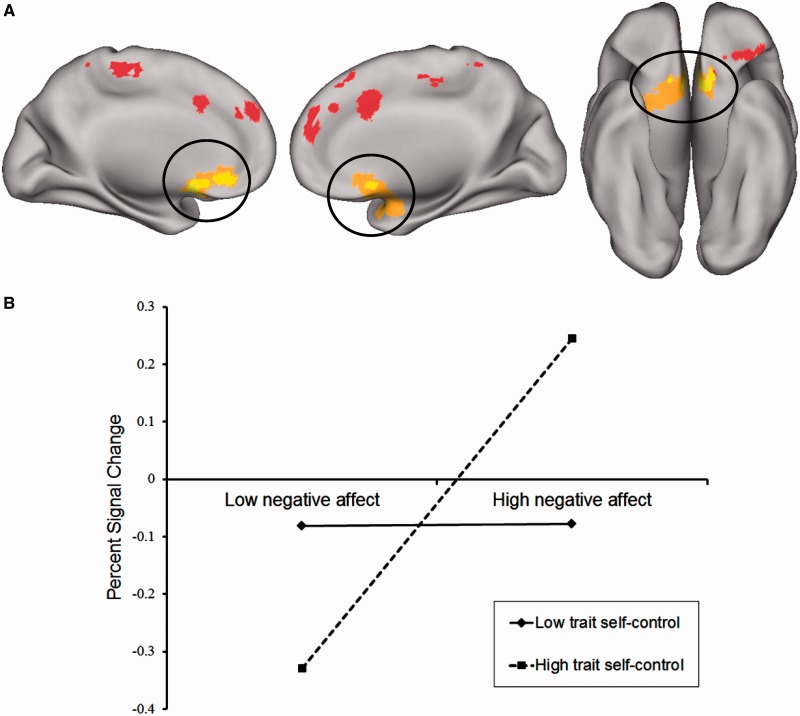
Fig. 2.
(A) The main effect of state NA and the interaction of state NA and trait self-control were associated with activation during the n-back in partially overlapping portions of vmPFC (circled). Voxels exhibiting activation associated only with state NA and state NA X trait self-control are depicted in red and orange, respectively, whereas overlapping voxels are depicted in yellow. Activation maps are shown on an inflated surface map (neurological orientation) in Caret (Van Essen, 2005). (B) The association between state NA and activation of the vmPFC during the n-back task (3-back minus 0-back) plotted at high (mean + 1 s.d.) and low (mean – 1 s.d.) values of trait self-control.

