
Figure 6.
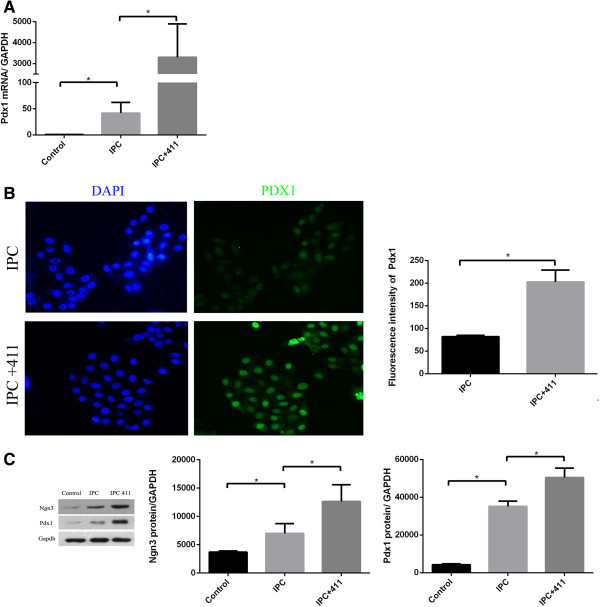
RNA and protein levels of insulin-related genes in IPCs. (A) After glucose stimuli IPCs with or without laminin 411 group mRNA level of Pdx1 was determined using RT-PCR and expressed relative to an undifferentiated control and normalized to GAPDH. (B) Immunofluorescence staining of Pdx1 in IPCs with or without laminin 411. After culturing them for 4 stages, IPCs with or without laminin 411 were incubated with anti-human Pdx1 antibody. Nuclei were stained blue with DAPI. Quantitative analysis of mean fluorescence density of Pdx1 staining was shown on the left. (C) Western blot analysis. Protein level of Ngn3 and Pdx1 of IPCs with or without laminin 411. Each bar is the mean ± SEM (n = 3), *P < 0.05.