
Figure 8.
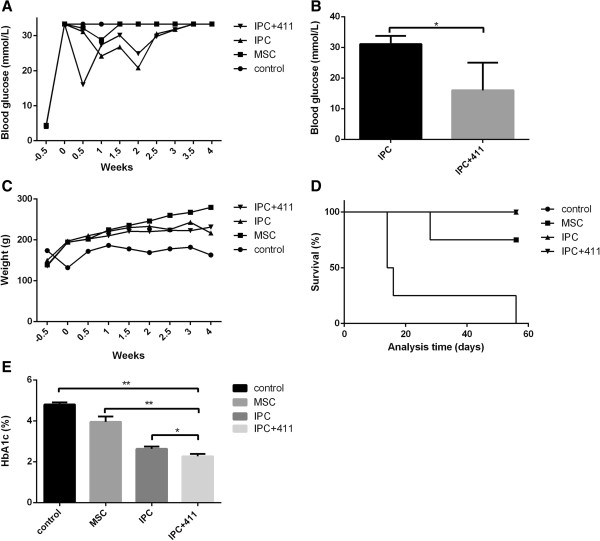
Blood glucose level, weight and survival analysis of STZ induced T1DM rats. (A) Fasting blood glucose levels were monitored twice a week as indicated in samples obtained from the tail vein using Blood Glucose Test Strips (Roche Diagnostics, Basel, Switzerland). Blood glucose over 33.3 mmol/L was beyond the measuring scale. (B) Fasting blood glucose level 3 days after IPCs with laminin 411 infusion, Bars: mean ± SEM (n = 3), and *P < 0.05. (C) Weights were monitored twice a week as indicated. (D) Survival curve of animal tests. (E) HbA1c level at the endpoint of the experiments. Bars: mean ± SEM (n = 4), and *P < 0.05, **P < 0.01.