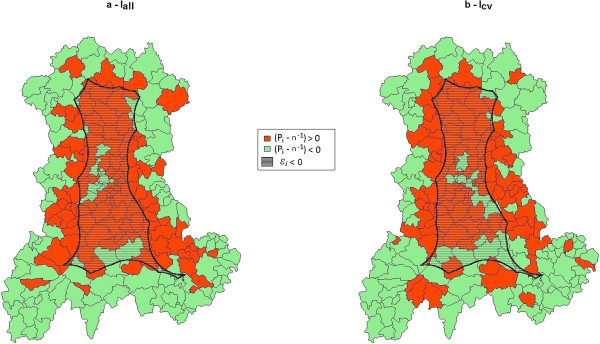
Figure 8.

Overlaying of the sign of the difference between observed and expected values of SUs participation rates (computed over 20 000 simulated datasets for each map) and the sign of the edge coefficient ϵi (ϵi negative in hatched area). (a) Baseline incidence of birth defects set to 2.26%. (b) Baseline incidence of birth defects set to 0.48%.
