Figure 6.

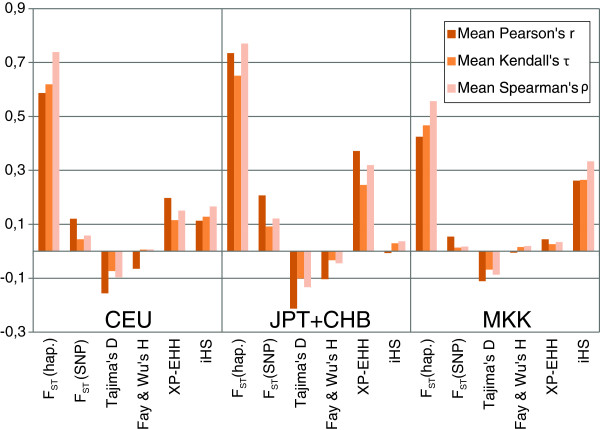
Correlations between MFPH and the window mean of different summary statistics for HapMap III phased data using a window-size of 300 SNPs with a step length of 1 SNP.

Correlations between MFPH and the window mean of different summary statistics for HapMap III phased data using a window-size of 300 SNPs with a step length of 1 SNP.