
Figure 3.
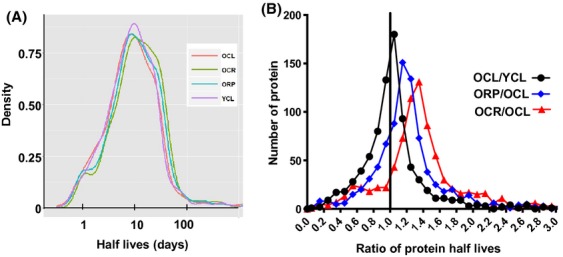
Global proteomic half-lives. (A) Histograms of half-lives (days). YCL versus OCL: n.s., OCL versus OCR P < 0.001; OCL versus ORP, P = 0.038; OCR versus OR, P = 0.08. (B) Histograms of half-life ratios for two-group comparisons. P = 0.09 for YCL/OCL >1, P < 0.001 for both OCR/OCL and ORP/OCL >1.