Figure 6.
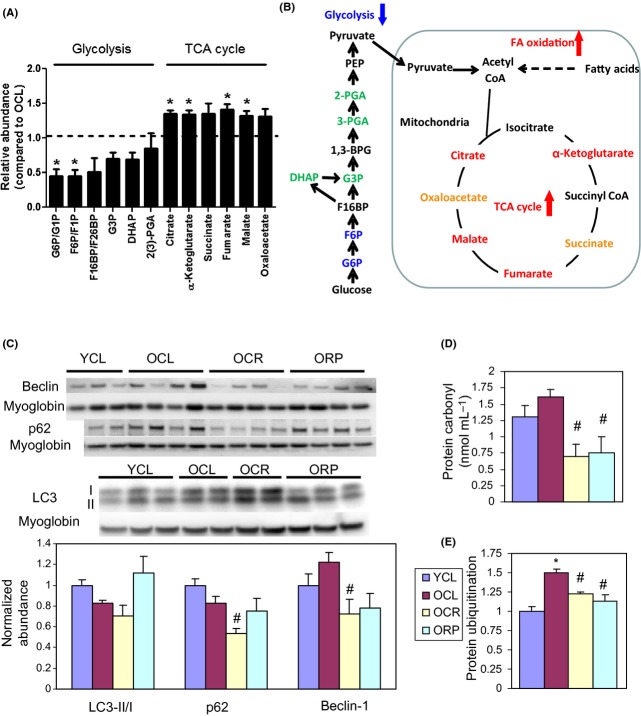
Metabolic profiling and biochemical assay. (A) Relative abundance of the substrates in the glycolytic pathway and TCA cycle in ORP compared to OCL by targeted metabolic profiling. When compared with OCL heart, ORP hearts have significantly lower glucose-6-phosphate and fructose-6-phosphate (both are glycolytic metabolites), and significantly higher a-ketoglutarate, fumarate, malate, and citrate (all are TCA cycle metabolites). *P < 0.05 compared with OCL. See Table S6 for numerical data. (B) A schematic diagram summarizing the changes in metabolism by rapamycin in old heart. (C) Western blots of autophagic markers show no significant change of LC3 II/I, p62, or beclin-1 in cardiac aging. However, OCR has significantly lower p62 than that in OCL. #P < 0.05 compared with OCL. (D) Both CR and RP significantly reduce the age-dependent increase in protein carbonyls (nmol mL−1). #P < 0.05 compared with OCL. (E). Both CR and RP significantly reduce the age-dependent increase in protein ubiquitination.*P < 0.05 compared with YCL and #P < 0.05 compared with OCL. n = 3–8. G6P: glucose 6-phosphate; G1P: glucose 1-phosphate; F6P: fructose 6-phosphate; F1P: fructose 1-phosphate; F16BP: fructose 1,6-bisphosphate; F26BP: fructose 2,6-biphosphate; G3P: glyceraldehyde 3-phosphate; DHAP:dihydroxyacetone phosphate; 2(3)-PGA: 2- or 3-phosphoglycerate; and PEP: phosphoenolpyruvate. Isomers of same molecular weight, that is, G6P versus G1P, F6P versus F1P, and F16BP versus F26BP, were not distinguishable by the LC-MS/MS-based metabolic profiling method.

