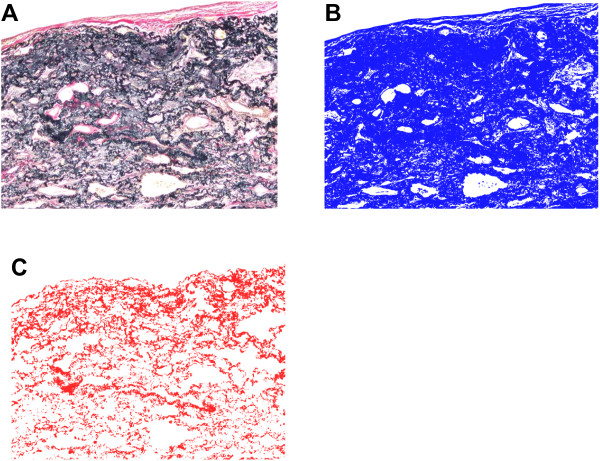
Figure 2.

Images of lung sections in a patient with idiopathic pleuroparenchymal fibroelastosis (IPPFE). The images were made using a microscope with a camera equipped with a charge-coupled device and image analysis software. Surgical lung specimens were stained with Elastica van Gieson (A), and imaged lesions at 40x magnification in all specimens were captured. Images were changed to gray scale, then binarized to detect the area containing the fibrotic lung lesion using software (B, blue area). The images were binarized with another threshold to estimate elastic fibers (C, red area). The concentration of elastic fibers (EF score) in the fibrotic area was calculated by dividing the pixel number of elastic fibers (red area) by that of the target fibrotic lung lesion (blue area). Surgical biopsy images from one patient with an EF score of 27.5% are shown.
