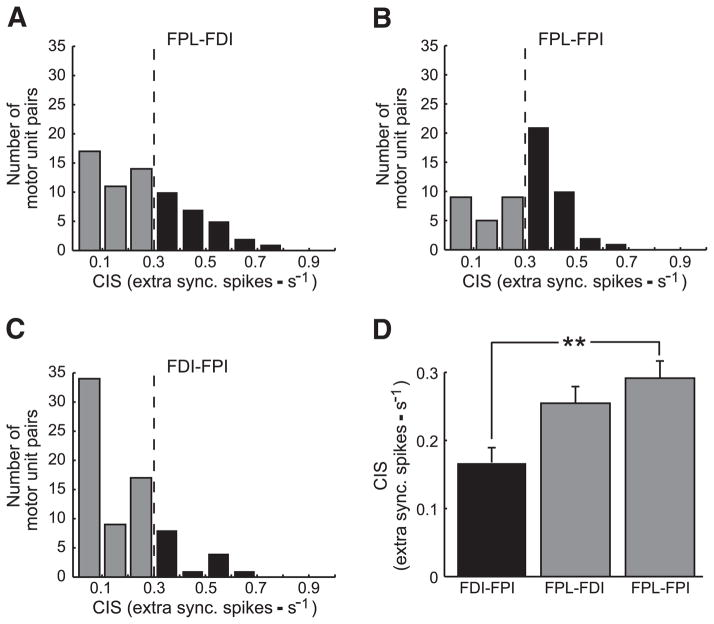
FIG. 3.
Common input strength (CIS) distributions. Distributions of CIS values for the extrinsic-intrinsic muscle pairs [m. flexor pollicis longus (FPL)-FDI and FPL-FPI; A and B, respectively] and the intrinsic muscle pair (FDI-FPI; C). For graphical purposes, CIS data were binned into 0.1 intervals. Gaps in the distributions indicate no motor-unit pairs with that CIS value. Vertical lines indicate an arbitrary cut-off (CIS: 0.3) between weak and moderate to strong motor-unit synchrony. D: mean CIS values (±SE) for each muscle pair are shown (**, significant difference at P < 0.001).

