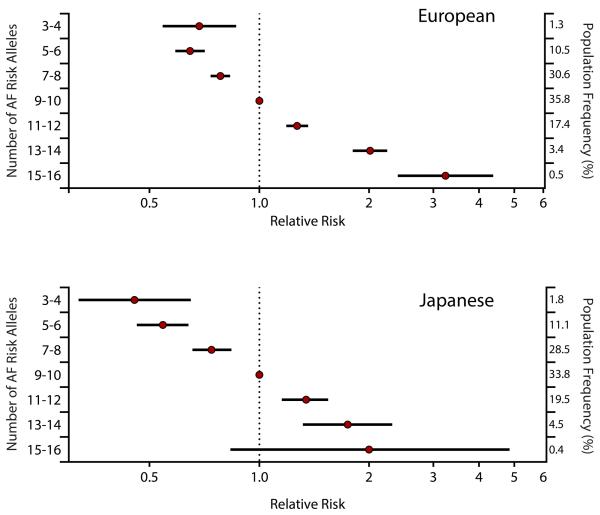
Figure 2. Graded relative risk of atrial fibrillation in European and Japanese populations.
The risk of atrial fibrillation is plotted according to the estimated atrial fibrillation risk alleles, relative to that among individuals with the most common number of estimated risk alleles for all genome-wide significant atrial fibrillation susceptibility loci. Data is plotted from individuals of European ancestry from AFGen and Japanese ancestry from BioBank Japan. Right axis denotes the population frequency of each category. Error bars represent the 95% confidence intervals. Adapted from Lubitz et. al, JACC 2014116.

