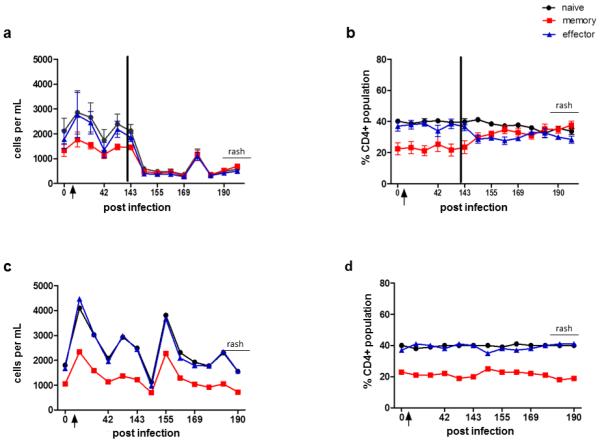
Fig. 2. CD4 T cells in blood from monkeys before and during experimental SVV infection, after immunosuppression and during virus reactivation (zoster).
At times indicated, blood was obtained and processed as described in Materials and methods. Flow cytometric analysis was used to calculate numbers of naïve (CD28+, CD95−), memory (CD28+, CD95+) and effector (CD28−, CD95+) T cells (a and c) and their percentages of CD4 T cells (b and d). Total CD4 T cell counts increased significantly in naïve, memory and effector populations 14 days post-infection (dpi) in all monkeys compared to those before infection (a and c; p<0.05). After immunosuppression, all T cell subsets declined (a, p<0.05), whereas at 176 dpi (2 weeks before zoster), all CD4 T cells increased (a, p<0.05). The percentage of naïve, memory and effector CD4 T cells remained constant (b). CD4 T cells in the non-immunosuppressed monkey also declined after transportation to the radiation facility, but not to the extent seen in immunosuppressed monkeys (c); the percentages of naïve, memory and effector T cells also remained stable (d). Arrow indicates day of inoculation; black bar indicates time of immunosuppression. Data points represent the mean value +/− SEM.

