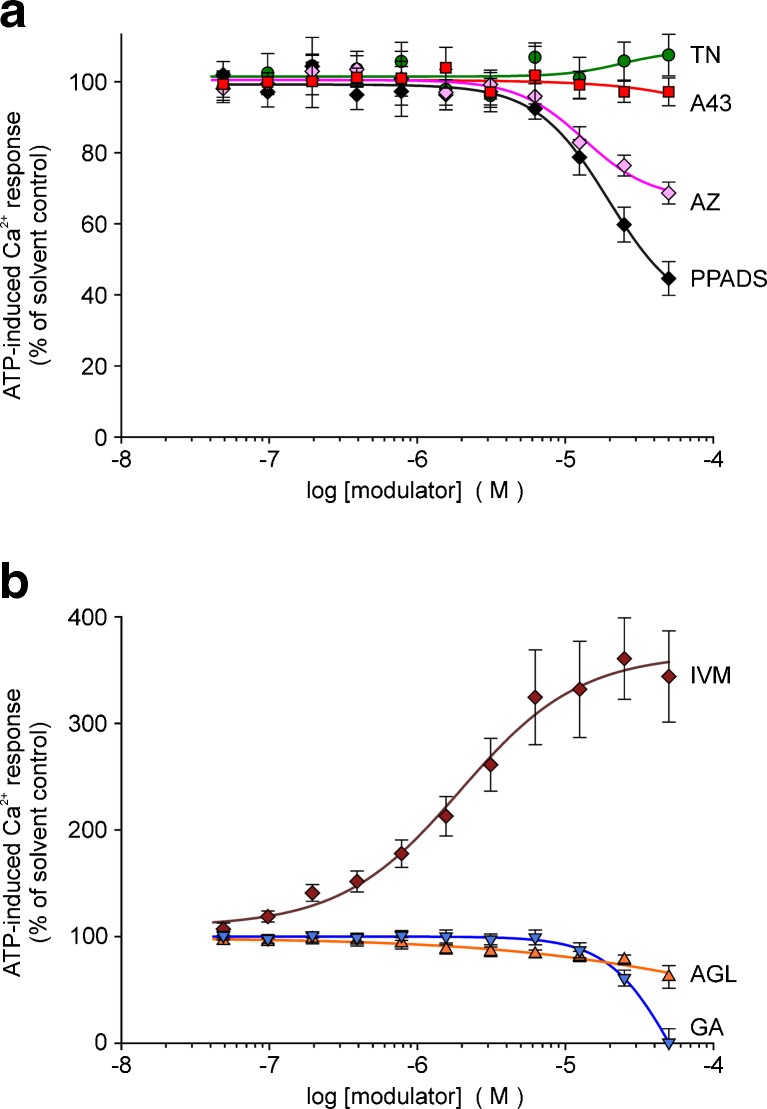
Fig. 4.
Effects of selected compounds on ATP (3 μM)-induced [Ca2+]i response in HEK hP2X4 cells (fluo-4 fluorometry, microplate reader). Concentration–response curves: a P2X7-blocking substances and PPADS; b P2X7-facilitating substances. Data represent means ± SEM (n = 4–6 independent experiments). Substance abbreviations and further details, see Fig. 3

