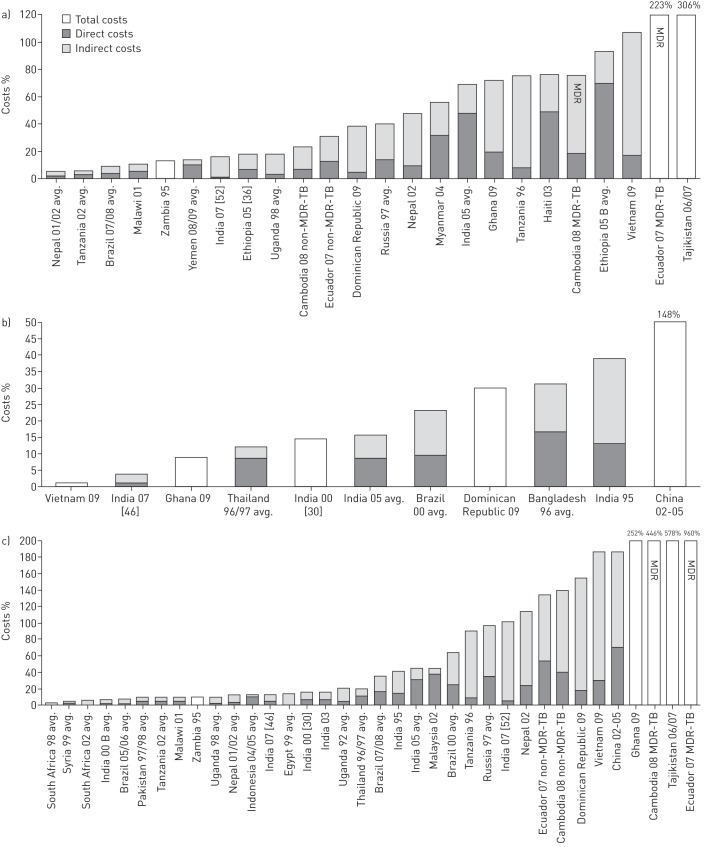
Figure 3–
Costs as percentage of a) reported annual individual income, b) reported annual household income and c) annual wage of the lowest quintile. The far right bars are truncated and percentages are shown above. avg.: average across subgroups for which separate means were reported in the original study. MDR: multidrug resistant; TB: tuberculosis.

