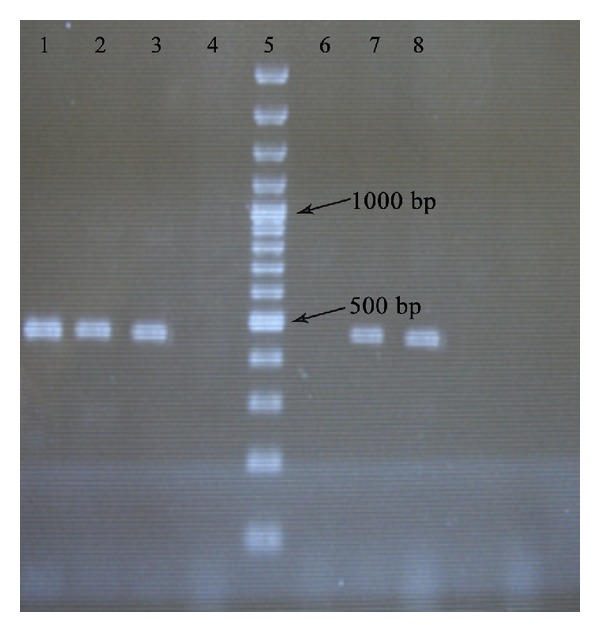
Figure 3.

Electrophoresis of bla- IMP (459 bp) PCR products on agarose gel. Line 1 is the positive control. Lines 2 and 3 show isolates positive for IMP. Line 4 is negative in PCR products. Line 5 shows 100–1000 bp ladder. Line 6 is negative control. Lines 7 and 8 show isolates positive for IMP.
