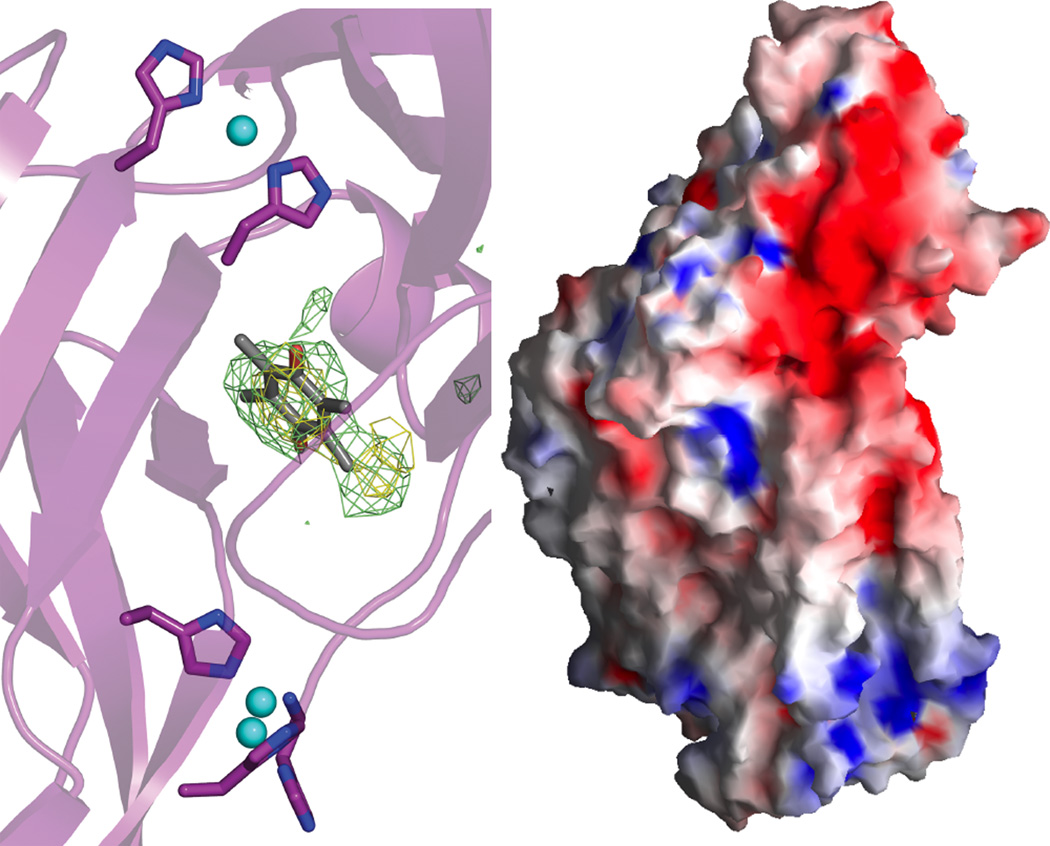
Figure 122.
(Left) Unmodeled electron density located at the interface of the pmoB β-barrels. The 2Fo–Fc density (contoured at 1σ) is colored light green and the Fo–Fc density colored yellow (contoured at 3σ). A duroquinone molecule (HIC-up ID DQN) is superimposed on the density. (Right) Surface representation of the pMMO protomer colored according to electrostatic potential: red, −12 kT; white, 0 kT; blue, +12 kT. (Reprinted with permission from Macmillan Publishers Ltd: Nature Ref. 685, copyright 2005.)

