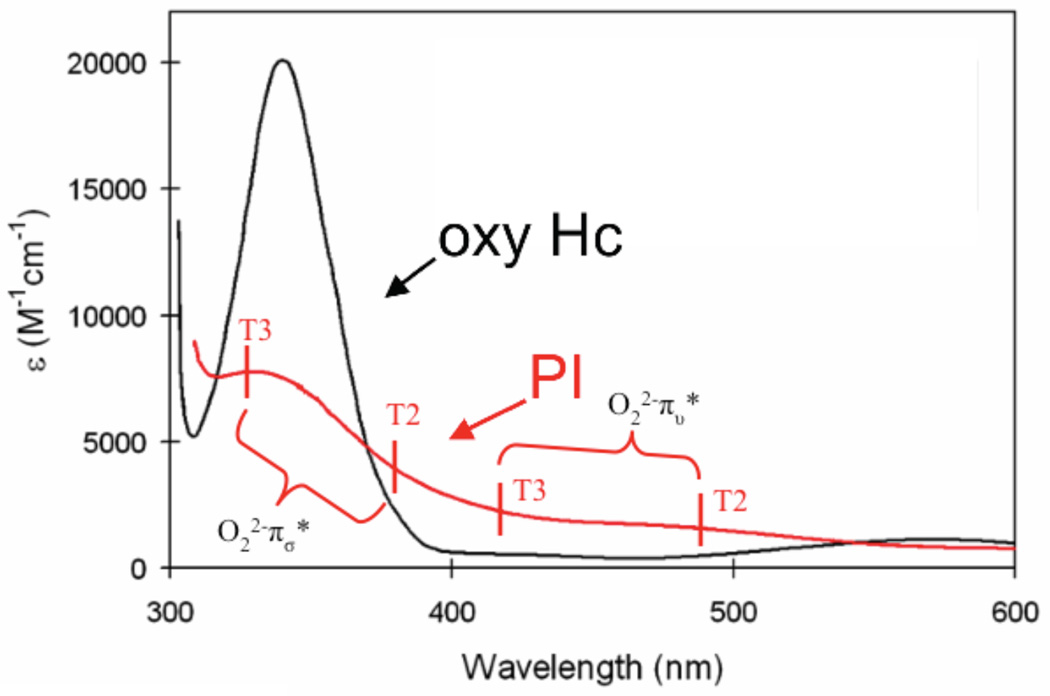
Figure 150.
(A) Absorption spectra of the charge transfer region of oxy-Hc (black) and PI (red). (B) RT Abs of the CT region of PI, with assignment of CT transitions indicated. (Reprinted with permission from Ref. 906. Copyright 2007 American Chemical Society.)

