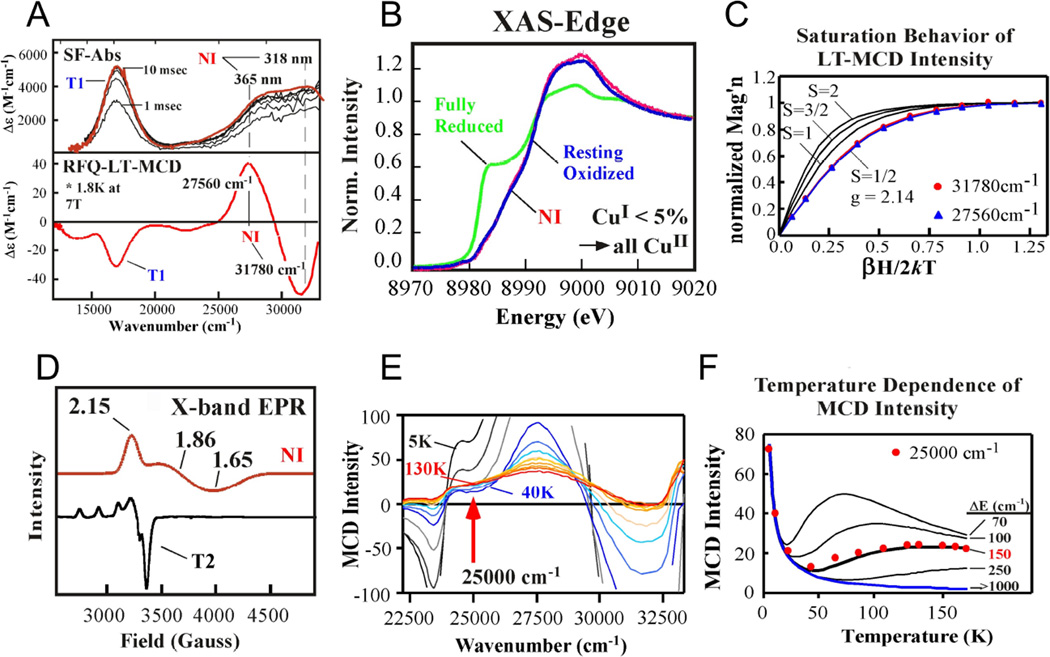
Figure 153.
Stopped flow absorption spectra (top) and rapid freeze quench MCD spectra (A), Cu K-edge XAS spectra (B), variable temperature, variable field behavior of the MCD spectra with Brillouin function fits with different values (C), low temperature X-band EPR (D), temperature dependence of the MCD spectra (E) and plot of temperature dependence of MCD intensity at 25,000 cm−1 of NI. (From Ref.597–Reproduced by permission of The Royal Society of Chemistry.)

