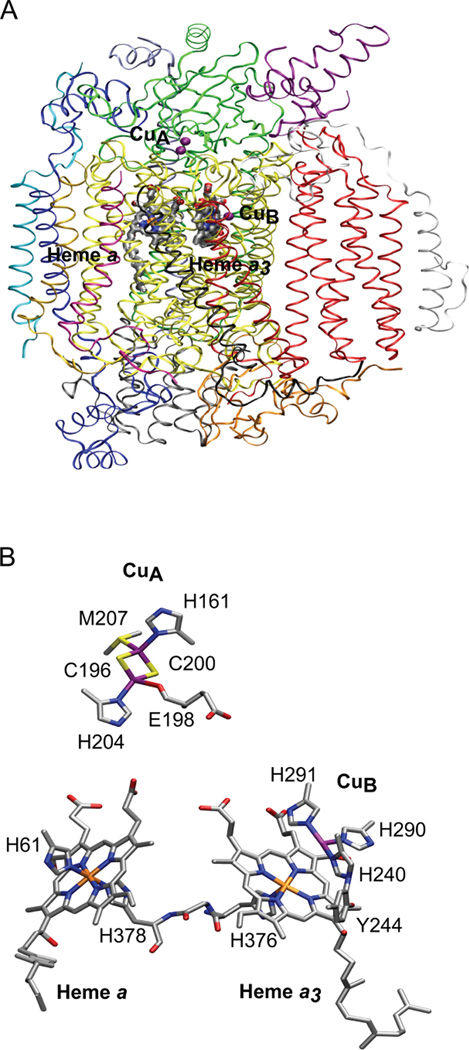
Figure 184.
Cytochrome c oxidase structure from bovine heart. (A) Overall structure where the 13 subunits are shown in different colors [subunit I (yellow), subunit II (green), subunit III (red), subunit IV (dark blue)]. (B) Expanded view of the redox active metal centers. CuA···Fea = 20.6 Å; CuA···Fea3 = 23.2 Å; Fea···Fea3 = 13.4 Å; CuB···Fea3 = 5.2 Å. Figure generated from PDB ID 2Y691006 coordinates using VMD.

