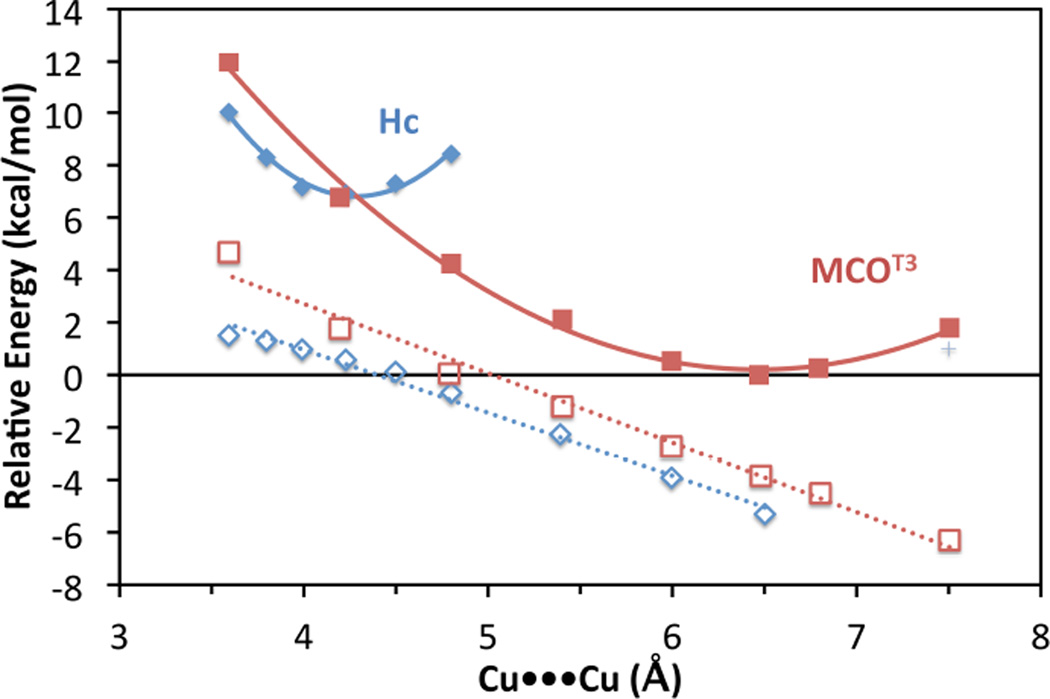
Figure 52.
A Cu•••Cu potential energy surface for deoxy-Hc (blue diamonds) and deoxy-T3 MCO (red squares, MCOT3). A comparison of the constrained surface (frozen α-carbons represented by filled symbols) and the unconstrained surface (open symbols) indicate that the energy difference between deoxy-Hc and the deoxy T3 site is due to electrostatic repulsion between the coppers.

