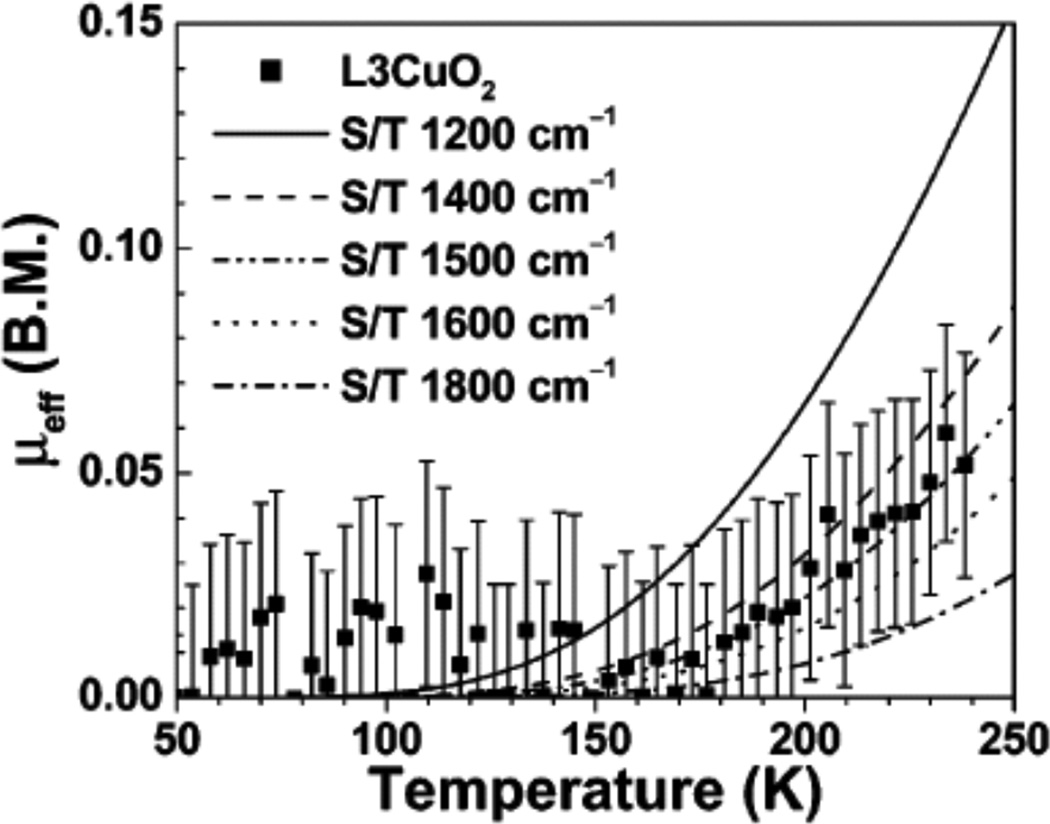
Figure 93.
SQUID measured effective magnetic moment μeff (B.M. = Bohr magneton) of L3CuO2. Lines are the simulated curves assuming the S/T energy splitting (ES=1 – ES=0) = 1800, 1600, 1500, 1400, or 1200 cm−1. (Reprinted with permission from ref 121 Copyright 2003 American Chemical Society.)

