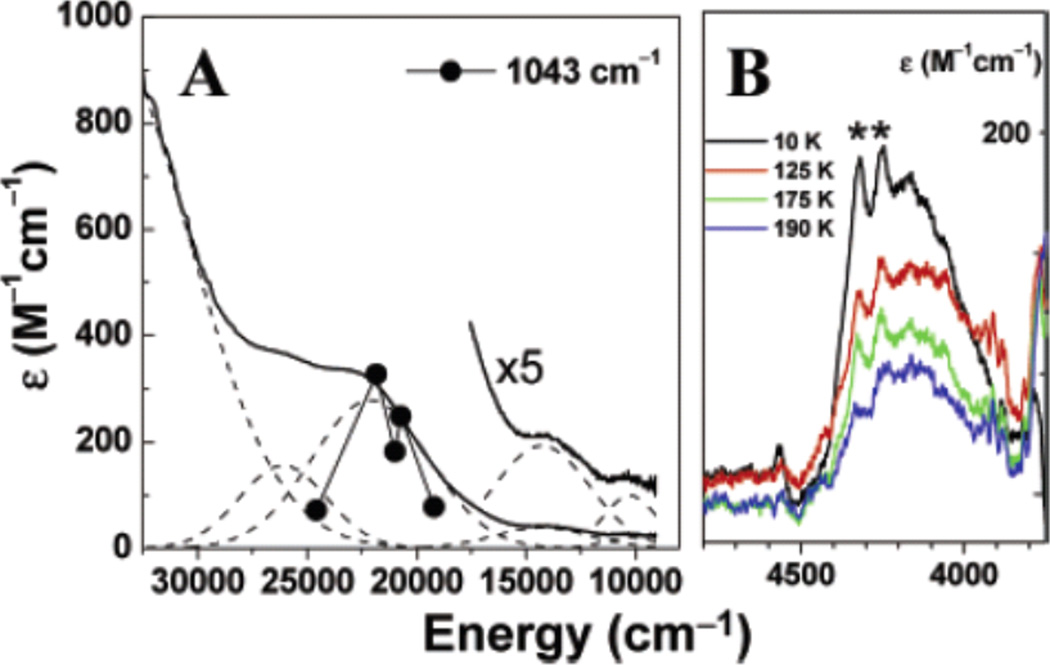
Figure 94.
A. UV/vis absorption spectrum of L10CuO2 in CH2Cl2 at −70 °C (solid line) with Gaussian resolved individual transitions (dashed lines). Overlaid is the rR profile of the 1043 cm−1 vibrational mode of L10CuO2 (•). B. Variable temperature near-IR mull absorption spectra of L10CuO2. Vibrational overtones of the mulling agent are labeled as “*”.(Reprinted with permission from ref 121 Copyright 2003 American Chemical Society.)

