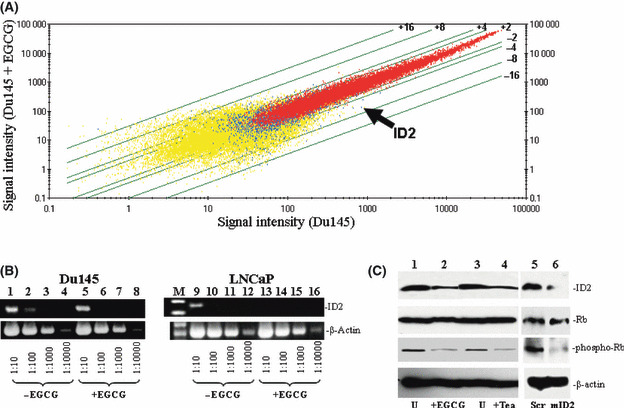
Figure 2.

Downregulation of inhibitor of DNA binding 2 (ID2) in Du145 by (−)‐epigallocatechin‐3‐gallate (EGCG). (A) Affymetrix Hu133 2.0 gene chip analysis was carried out to analyze the gene expression alteration of Du145 treated with 80 μm EGCG for 3 days. Scatter plots of the signal intensities of over 54 000 probe sets of Du145 cells treated with EGCG versus those from cells without treatment were shown. Lines represent cut‐offs of the indicated fold changes (≥twofold). Arrow indicates the plot of the ID2 gene. (B) Semiquantitative RT‐PCR of the ID2 gene in Du145 and LNCaP cells. Du145 or LNCaP cells were treated with or without EGCG. cDNA (200 ng) from Du145 (left) and LNCaP (right) was titrated to the indicated dilutions. PCR were carried out using primers specific for ID2 or β‐actin. The PCR products were then electrophoresed and visualized in 2% agarose gel. (C) Immunoblotting analysis of ID2 and Rb1 phosphorylation in Du145 cells. Proteins from Du145 cells treated with 80 μm EGCG (or 3% tea), or 3% PBS (U), or scramble (Scr) or ID2‐specific (mID2) morpholino oligonucleotides were extracted, electrophoresed in 7% SDS‐PAGE gel, and immunoblotted with the indicated antibodies.
