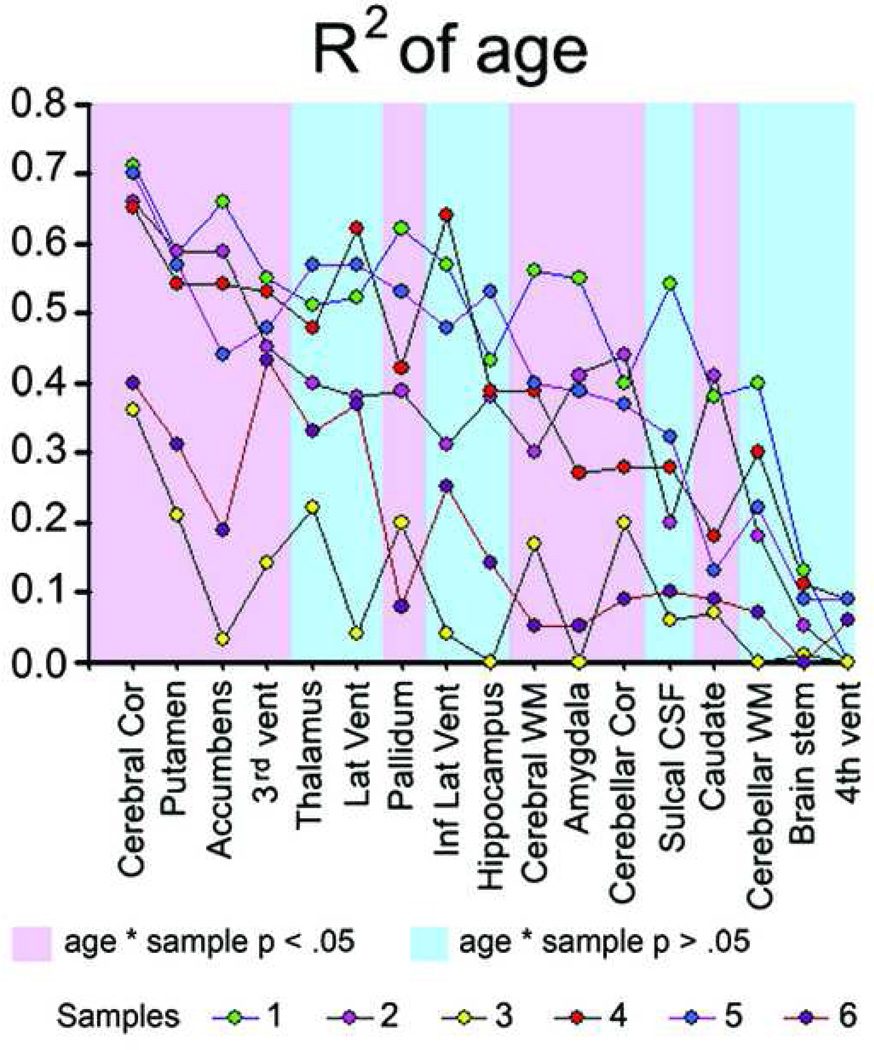
Figure 3. Amount of age-explained variance for each structure in the separate samples.
The figure shows the R2 (amount of explained variance) of age for each of the tested structures in each sample separately. Pink background: structures for which a significant (p < .05) age × sample interaction were found. Blue background: structures for which no significant (p > .05) age × sample interaction were found.

