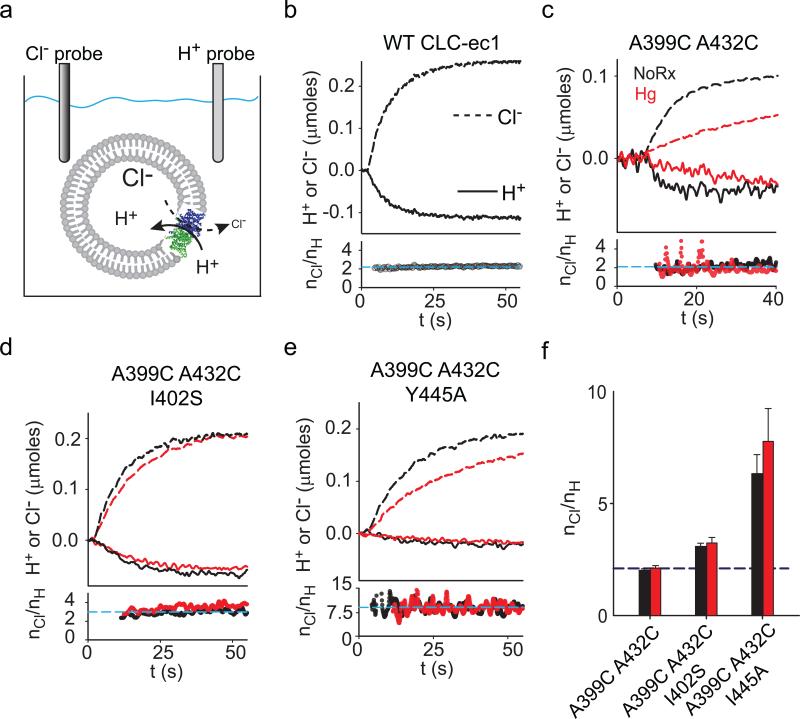
Figure 6. Effects of crosslinking helix O on the Cl–/H+ exchange stoichiometry.
a) Schematic representation of the simultaneous Cl– and H+ flux recordings. b-e) Upper panels: simultaneous recordings of Cl– efflux into (dashed lines) and H+ efflux from (solid lines) proteoliposomes reconstituted with WT CLC-ec1 (b), A399C A432C (c), A399C A432C I402S (d) or A399C A432C Y445A (e) before (black traces) and after (red traces) formation of the crosslink. Bottom panels: time course of the stoichiometry of transport (nCl/nH) determined as the ratio of the total transported Cl– and H+ ions. Dashed cyan line indicates the average value for the traces shown. e) Average stoichiometry of transport for the A399C A432C (nCl/nH(NoRx)= 2.0±0.1, n=5; nCl/nH(Hg)= 2.1±0.1, n=8), A399C A432C I402S (nCl/nH(NoRx)= 3.1±0.1, n=7; nCl/nH(Hg)= 3.2±0.2, n=8) and A399C A432C Y445A (nCl/nH(NoRx)= 6.3±0.8, n=5; nCl/nH(Hg)= 7.8±1.4, n=4) mutants before (black bars) and after (red bars) Hg treatment. The dashed blue line indicates the WT value (nCl/nH= 2.2±0.1, n=5). Data shown is the average±s.e.m. of n experiments from 2+ independent preparations.

