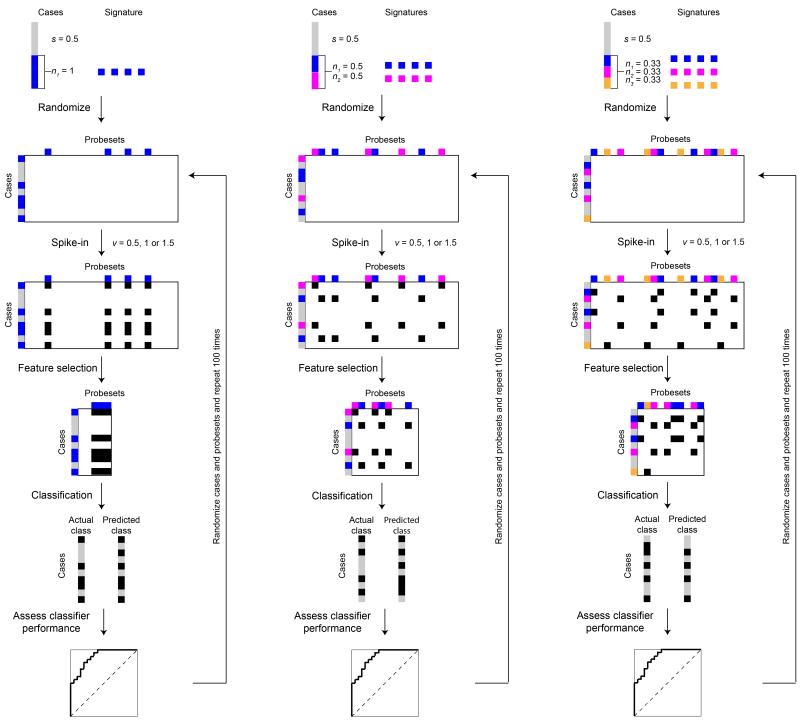
Figure 1. Schematic representation of the study design.
Perturbed datasets were generated using microarray-based gene expression profiles of 1,550 breast cancer cases analyzed with the Affymetrix U133a2 platform. We assumed that s% of the cases were therapy sensitive (grey boxes), while the remaining 1-s% were therapy resistant (colored boxes). Within the 1-s% resistant cases, we further assumed that there were n resistance mechanisms, where the resistant cases were randomly allocated into the nth resistance mechanism (colored boxes). For illustration purposes, we assumed up to three resistance mechanisms (i.e. n=1, 2 or 3). Each resistance mechanism was represented by adding v (v=0.5, 1.0 or 1.5) to the Log2-expression value of 100 randomly selected, but not necessarily mutually exclusive, probes (black boxes). Predictive signature models were derived by ranking the features (probes) by t-tests using the CMA package. The top 100 features were then used as the predictive gene signature for diagonal linear discriminant analysis (DLDA) or supervised principal components (superPC) classification. Validation of the predictive gene signature was performed by stratified 3-fold Monte-Carlo cross-validation, repeated 50 iterations. Comparing the predicted and actual classes, we calculated the area under curve of receiver operating characteristic curves, sensitivity, specificity, accuracy, positive predictive value and negative predictive for each predictive gene signature. For each combination of variables, we repeated the spiking-in and classification up to 200 times.

