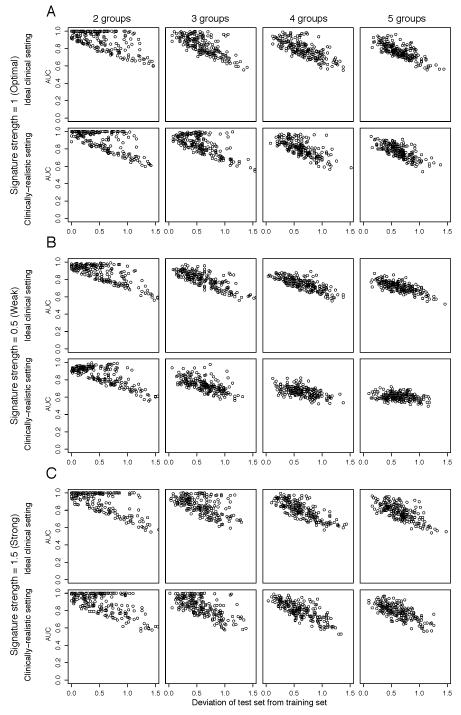
Figure 4. Comparative impact of multiple unevenly distributed resistance mechanisms with random and independent prevalence in training and test sets on the performance of the predictive gene signatures.
Perturbed datasets in which s% (s%=5%, 10%, 20%, 30%, 40% or 50%) of the cases were designated to be therapy sensitive were generated. Within the resistant 1-s% cases, the cases were allocated randomly into n (n=2, 3, 4, 5) groups of resistance mechanisms and the case allocation for training and test datasets was performed independently, in both test and training sets, the total proportion of resistant cases is identical. For each nth resistance mechanism, 100 genes were randomly selected as the “true” gene expression changes and were spiked-in by v (v=0.5, 1, 1.5). For each combination of s, n and v, we repeated the spiking and classification 200 times. The performance of the predictive gene signature for each repeat where each data point represents the median of 50 Monte-Carlo Cross Validation (MCCV) repeats. The performance of the predictive gene signature was measured by the area under curve (AUC) of receiver operating characteristic (ROC) curves. For v=1 (A, labeled “Signature strength=1 (Optimal)”), v=0.5 (B, labeled “Signature strength=0.5 (Weak)”) and v=1.5 (C, labeled “Signature strength=1.5 (Strong)”), AUC is plotted against the deviation of the sizes of the distinct resistance mechanism groups in the test dataset from those in the training dataset, calculated as where fi,test is the size of the ith subgroup in the test set and fi,train is the size of the ith subgroup in the training set for (from left) n=2 (labeled “2 groups”), n=3 (labeled “3 groups”), n=4 (labeled “4 groups”) and n=5 (labeled “5 groups”). For each of (A), (B) and (C), AUCs are plotted for the “Ideal clinical setting” (where s%=50%) and for “Clinically-realistic setting” (where s%=10%).

