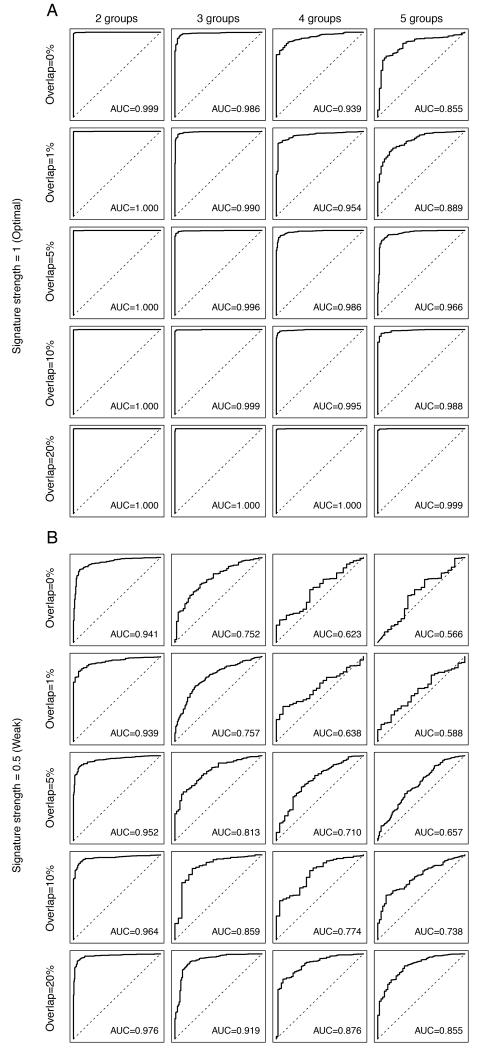
Figure 5. Impact of the extent of overlapping gene expression changes caused by distinct mechanisms of resistance on the performance of the predictive gene signature.
Perturbed datasets in which s% (s%=5%, 10%, 20%, 30%, 40% or 50%) of the cases were designated to be therapy sensitive were generated. Within the 1-s% resistant cases, we allocated the cases randomly into n (n=2, 3, 4, 5) equally sized groups of resistance mechanisms. For each nth resistance mechanism, 100 genes were selected as the “true” gene expression changes, of which o% (o%=0%, 1%, 5%, 10%, 20%) of the 100 genes were common to all n mechanisms. The selected genes were then spiked-in by v (v=0.5, 1, 1.5). For each combination of s, n, o and v, we repeated the spiking and classification 100 times. Representative receiver operating characteristic (ROC) curves of the cases where the Log2-expression of the “true” gene expression changes were spiked-in by 1 (A, labeled “Signature strength=1 (Optimal)”) and 0.5 (B, labeled “Signature strength=0.5 (Weak)”). Within each of A and B, we showed the representative ROCs depicting the mean area under curve (AUC) for simulations where 1-s%=90%, and o%=0% (“Overlap=0%”), o%=1% (“Overlap=1%”), o%=5% (“Overlap=5%”), o%=10% (“Overlap=10%”), o%=20% (“Overlap=20%”)(top to bottom). Within each row, the representative ROCs for n=2 (“2 groups”), n=3 (“3 groups”), n=4 (“4 groups”), n=5 (“5 groups”) groups of resistance mechanisms are shown. The AUC values presented are the mean values for n resistance mechanisms.

