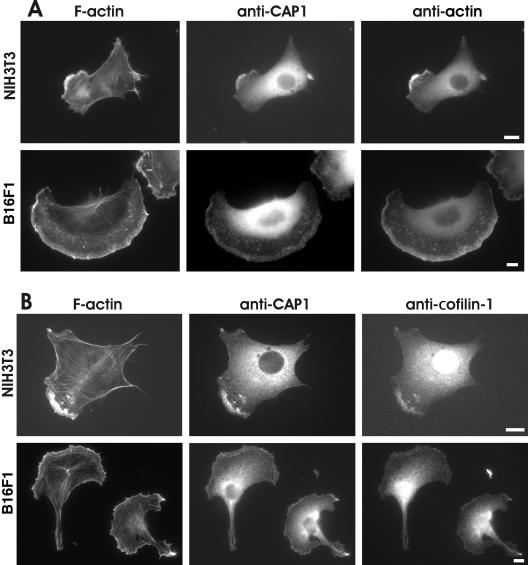
Figure 3.
Localization of CAP1 in NIH3T3 and B16F1 cells. (A) Cells were stained with Alexa488-phalloidin to visualize F-actin (left), with anti-CAP1 antibody (middle), and with AC15 anti-actin antibody to visualize monomeric actin (right). CAP1 localizes to actin-rich regions of cell cortex and behind the leading edge of the lamellae. (B) F-actin (left) and CAP1 (middle) were visualized in NIH 3T3 and B16F1 cells as described above, and cofilin-1 was visualized by an isoform-specific polyclonal cofilin-1 antibody (right). CAP1 and cofilin-1 show clear colocalization at the cortical actin cytoskeletons of these cells. Bar, 10 μm.

