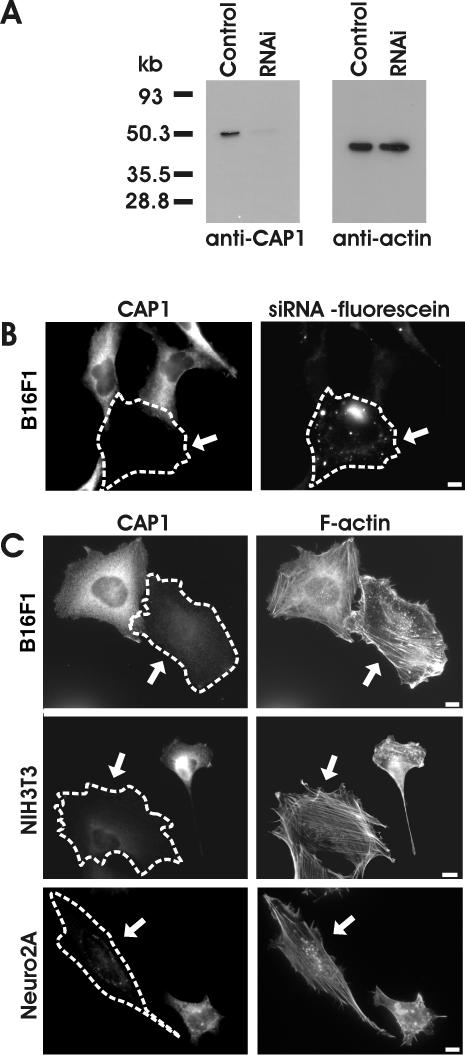
Figure 4.
Depletion of CAP1 by siRNA results in an accumulation of stress-fibers and abnormal morphology in NIH3T3, B16F1, and Neuro2A cells. (A) Western blot analysis demonstrating the CAP1 protein levels in B16F1 control cells and in B16F1 cells transfected with CAP1-specific RNAi oligonucleotide duplex. Equal amounts of cell lysates were run on polyacrylamide gels, and CAP1 (left) and β/γ actin were visualized by Western blotting. (B) Cells transfected with fluorescein-labeled CAP1-siRNA oligonucleotides were stained with anti-CAP1 antibodies. Note, that the cell containing fluorescein-labeled oligonucleotides (arrow) has severely reduced CAP1 levels, whereas the nontransfected cells show normal level of CAP1-staining. (C) siRNA transfected B16F1 (top), NIH3T3 (middle), and Neuro 2A (bottom) cells were stained with anti-CAP1 antibodies (left) and Alexa488-phalloidin (right) to visualize the effect of CAP1 depletion for the actin cytoskeleton. The CAP1 knockdown cells (arrows) showed abnormal accumulation of thick stress-fibers compared with nontransfected wild-type cells. In NIH 3T3 and Neuro 2A cells, the CAP1 depletion also resulted in the loss of membrane ruffles, whereas in B16F1 cells CAP1 depletion resulted in a decreased polarity of existing membrane ruffles. Bar, 10 μm.

