Figure 6.
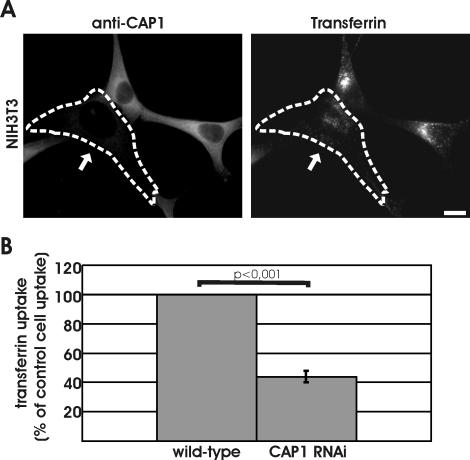
Depletion of CAP1 results in defects in receptor-mediated endocytosis. (A) Uptake of transferrin was compared between wild-type and CAP1 knockdown cells. Cells were incubated for 7 min in 20 ng/ml rhodamine-transferrin and stained with anti-CAP1 antibody (left) to visualize CAP1 knockdown cells (white arrow). Depletion of CAP1 from cells resulted in a decrease in transferrin uptake. Instead of strong perinuclear accumulation, transferrin (right) showed uniform punctate cytoplasmic staining in CAP1 knockdown cells. Bar, 10 μm. (B) Intensity of rhodamine-transferrin fluorescence was quantified by TINA software from 20 knockdown cells and compared with the intensity of rhodamine fluorescence of an adjacent wild-type cell from the same frame. In CAP1 knockdown cells, transferrin uptake was reduced to 44% of the one in wild-type cells. SEM = 0.04 and statistical significance of the data (p < 0.001) are indicated in the graph.

