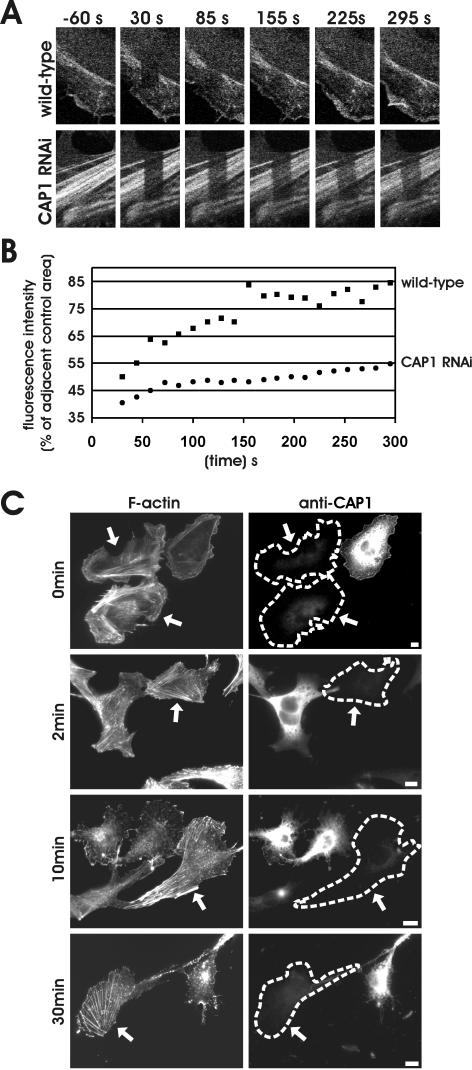
Figure 7.
Actin filament assembly and disassembly rates are severely diminished in CAP1 knockdown cells. (A) Actin filament treadmilling rates in wild-type and CAP1 knockdown cells were measured by using FRAP. Selected regions of B16F1 cells expressing GFP-actin were bleached by intense laser irradiation, and recovery of the bleached area was monitored by taking images every 14 s, starting 30 s after bleaching. Figure shows representative example of a wild-type cell (top) and CAP1 knockdown cell (bottom). (B) Rate of the fluorescence recovery was analyzed from the image series by TINA software. In each frame, the fluorescence intensity of the bleached region was compared with the fluorescence of the control region (in same picture next to bleached one) to diminish the error caused by normal photobleaching during the monitoring period. Recovery of the bleached regions in the CAP1 RNAi cells were significantly slower than in wild-type cells. (C) Actin filament depolymerization in wild-type and CAP1 knockdown cells were measured by using actin monomer-sequestering drug latrunculin-A. Cells were treated with 2 μm latrunculin-A, fixed at different time points (0, 2, 10, and 30 min), and F-actin and CAP1 were visualized by immunofluorescence. Actin filament structures were rapidly disrupted in wild-type cells, whereas in CAP1 knockdown cells (arrows) the disappearance of stress-fibers was significantly slower.

