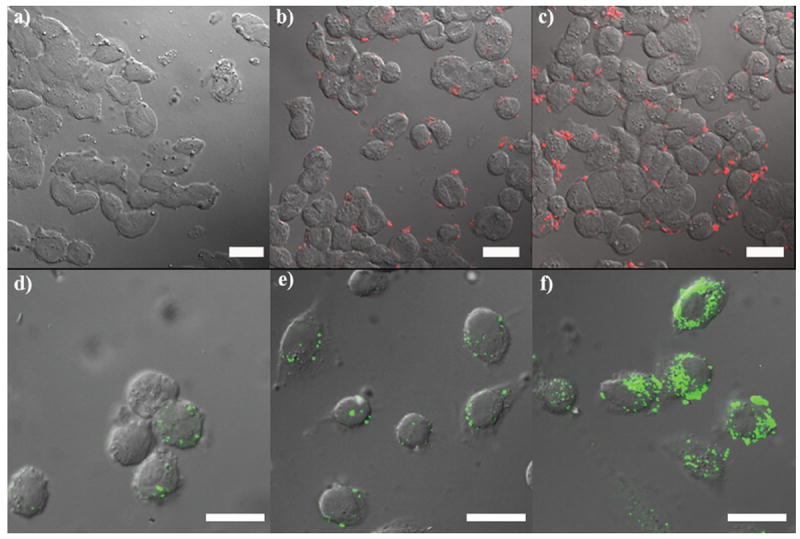
Figure 4.

Confocal microscope images of HT-29 (upper row) and AsPC-1 (lower row) cells incubated with MSN-based materials. The upper row depicts HT-29 cells incubated without RITC–Gd–MSN (control sample) (a), with RITC–Gd–MSN (0.1 mg mL−1) (b), and with RITC–Gd–MSN (0.4 mg mL−1) (c). The lower row shows confocal fluorescence images of AsPC-1 cells incubated with 0.03 mg mL−1 of FITC–Gd–MSNs (d), FITC–PEG–Gd–MSNs (e), and FITC–AA–Gd–MSNs (f). Scale bars represent 25 μm.
