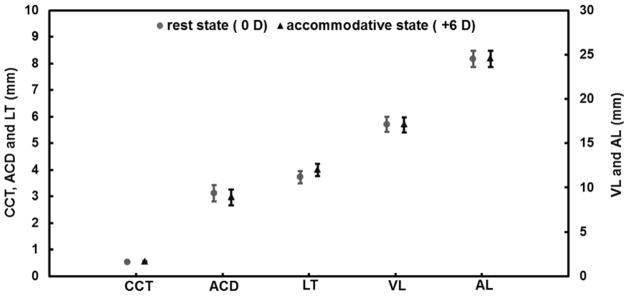
Figure 2.

Inter-session variations of each element of the axial biometry at rest and the accommodative states measured with ultra-long scan depth optical coherence tomography in the 21 left eyes of the 21 subjects. Compared to the rest state, ACD and VL decreased significantly (paired t-test, P < 0.001, respectively) and LT and AL increased significantly (paired t-test, P < 0.001). Bars = standard deviation.
CCT: central corneal thickness; ACD: anterior chamber depth; LT: lens thickness; VL: vitreous length; AL: axial length. Bars = standard deviation.
