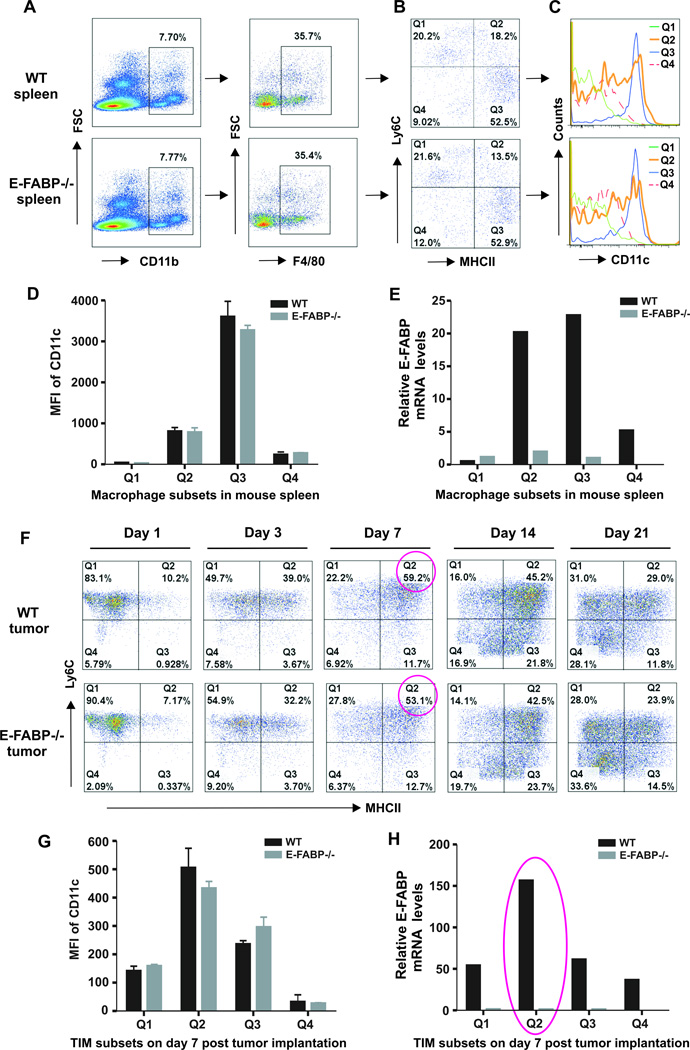
Figure 3. E-FABP is highly expressed in specific subsets of macrophages.
A, identification of CD11b+F4/80+ macrophages from mouse spleen. B, distinct subsets of splenic macrophages by Ly6C and MHC-II staining. Analyses of CD11c expression by flow histogram (C) and mean fluorescent intensity (MFI) (D), and E-FABP expression by real-time PCR (E) in distinct macrophage subsets. F, flow cytometric analysis of dynamic changes of distinct subsets of TAMs in tumor stroma at indicated time points after E0771 cell implantation. Analysis of CD11c expression by MFI (G) and E-FABP expression by real-time PCR (H) in distinct subsets of TAMs on day 7 post E0771 cell implantation.

