Figure 1.

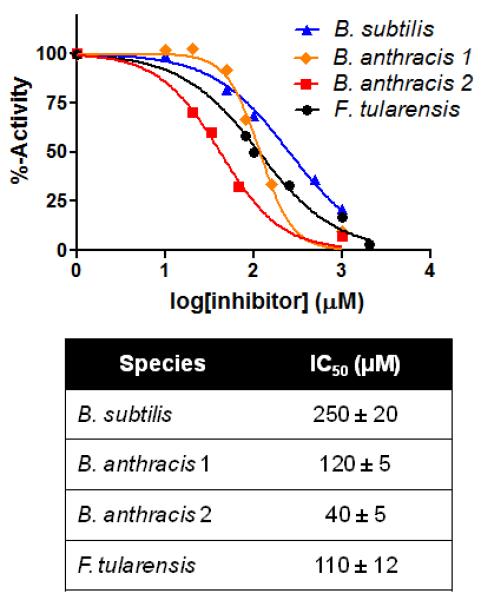
IC50 curves for the parent compound 2 against a range of GR isozymes isolated from the indicated bacterial species. Indicated IC50 values (in micromolar) acquired via fitting to a dose-response curve.

IC50 curves for the parent compound 2 against a range of GR isozymes isolated from the indicated bacterial species. Indicated IC50 values (in micromolar) acquired via fitting to a dose-response curve.