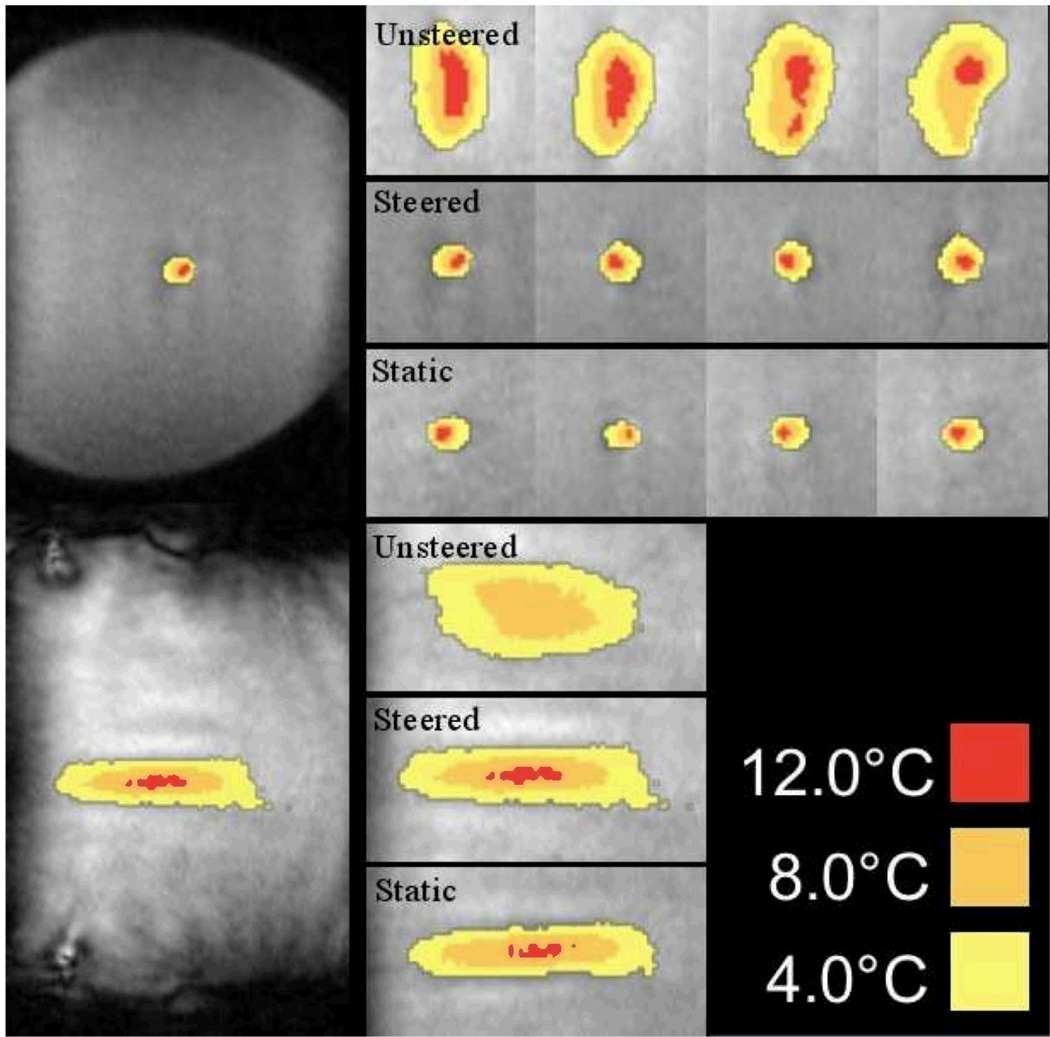
Figure 5. Phantom Sonication Images.
The following real time images show representative sonication images when the focus region reached a temperature of 15°C above baseline. The left most images show the entire phantom in the reduced field of view images (8 cm × 12 cm) for steered sonication cases. The other images are representative sonications for each of the three types: unsteered sonications (1st row), steered sonications (2nd row), and static sonications (3rd row). The bottom three images show representative unsteered (4th row), steered (5th row), and static (6th row) sonications in the direction parallel to the transducer in separate experiments. The steered sonications are very similar to the static sonications.

