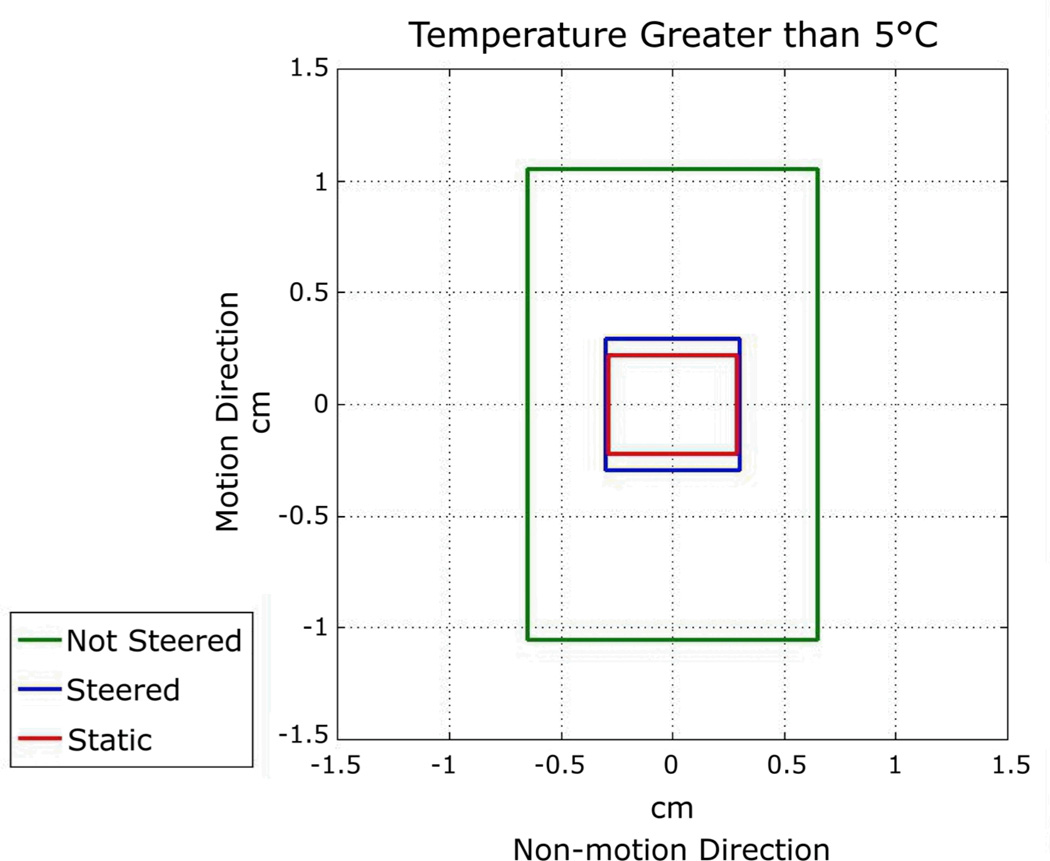
Figure 6. Phantom Sonication Spot Size Comparison.
The plot shows the general dimensions of the hotspots. These measurements were made in the images acquired perpendicular to the beam (top row of images of Figure 5). The measurements are for contours of 5°C temperature rise along the motion direction (up-down) and non-motion direction (left-right) for each of three sonication types: non-steered, steered, and static sonications. Steered sonication sizes are very close to static sonications. See Table 1 for more phantom sonication characteristic details. The difference in hotspot size in the non-motion direction is most likely explained by heat dispersion from the focus over the longer sonication duration.

