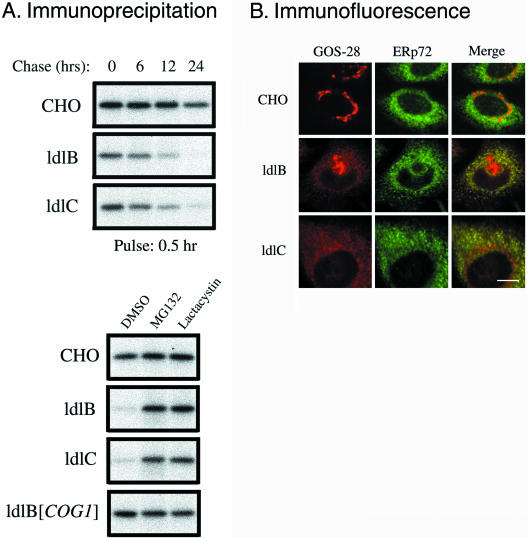
Figure 2.
Stability and intracellular distributions of GOS-28 in wild-type CHO, ldlB, and ldlC cells. (A) Cells were metabolically labeled with [35S]methionine/cysteine for 30 min (pulse), and then either chased for the indicated times in medium B containing unlabeled methionine and cysteine (top) or incubated for 24 h with the same medium plus 25 μM of the proteasome inhibitors MG132 or lactacystin (bottom). Cell lysates were subjected to immunoprecipitation with an anti-GOS-28 antibody. The immunoprecipitates were fractionated by SDS-PAGE, and the bands were visualized by autoradiography. (B) Cells were fixed and stained with antibodies to GOS-28 (red) and the ER marker ERp72 (green). To visualize the distribution of GOS-28 by using confocal microscopy, the images from ldlB and ldlC cells (weaker signals) were collected with higher signal gains than those from CHO cells. Note that because of the location of the section, some of the confocal images of the mutants do not show the perinuclear Golgi ribbon staining that is present (e.g., see Figure 1B). Bar, 10 μm.

