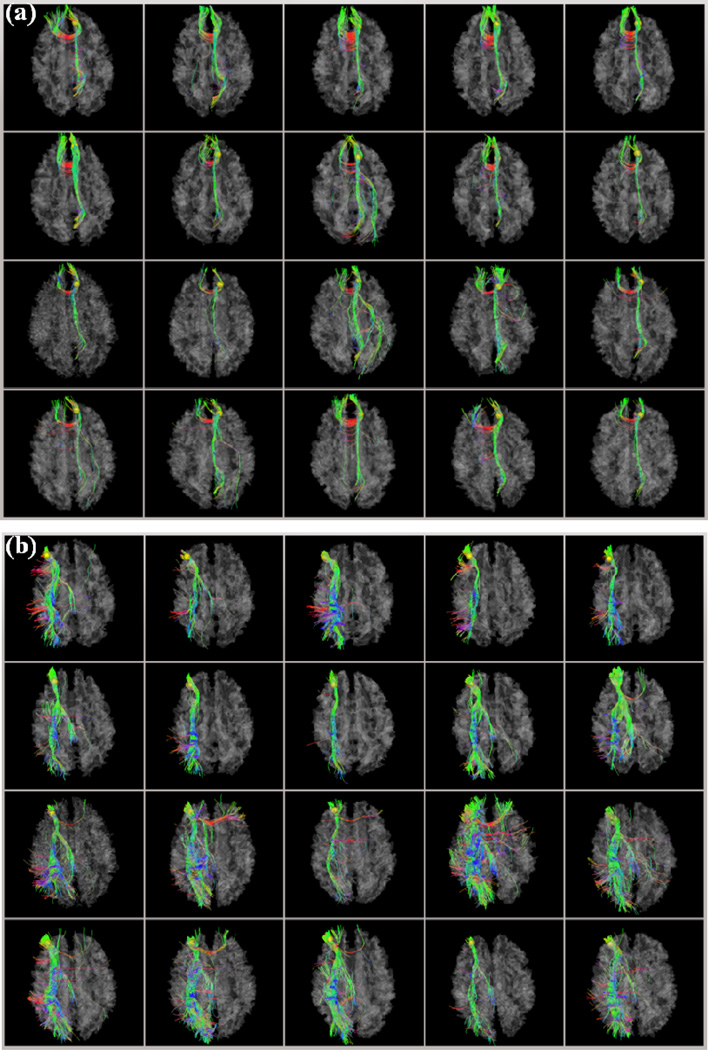
Figure 4.
Two examples of DICCCOL landmark prediction results in NC and MCI. The DICCCOL landmarks are represented by the yellow bubbles and their indices are (a) #311 and (b) #315 as shown in Fig. 2. For (a) and (b), the first two rows are 10 model brains, the third and fourth rows are the predicted results of five randomly selected brains in NC and MCI, respectively. More results are referred to http://dicccol.cs.uga.edu.

