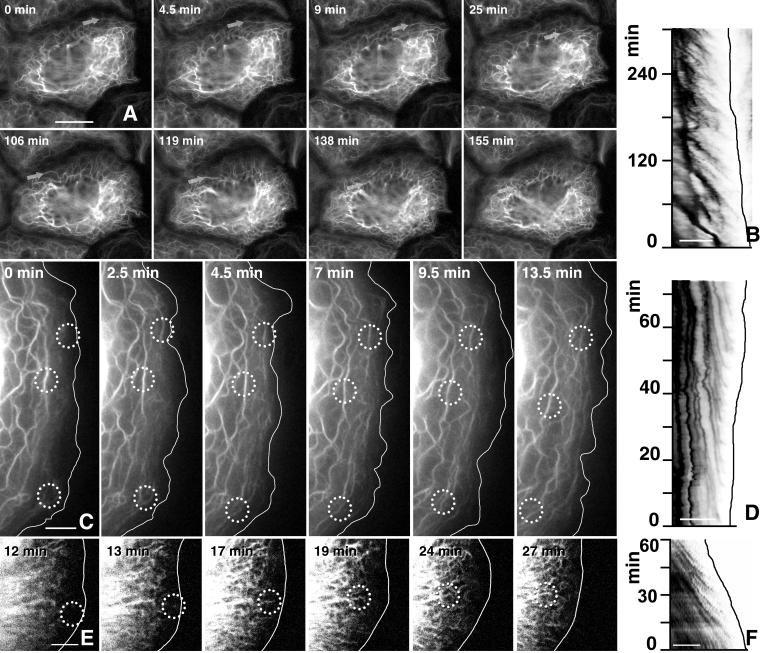
Figure 1.
Detection of keratin dynamics by epifluorescence microscopy in living hepatocellular carcinoma–derived PK18–5 cells synthesizing fluorescent keratin chimeras HK18-YFP (A–D) and in a primary human keratinocyte producing fluorescent HK14-YFP chimeras (E and F) either by epifluorescence microscopy (A–D) or by confocal laser scanning microscopy (E and F). (A, C, and E) Fluorescence micrographs taken from movies 1–3, respectively, depict the alterations of the keratin system in a confluent monolayer at low magnification (A) and at free cell borders at high magnification (C and E; position of plasma membrane demarcated by white line). Note the similarity of the overall KF network organization throughout the observation period in each case although a continuous reorganization occurs because of inward flow of filaments from the cell periphery (e.g., arrows in A and circled areas in C and E). (B, D, and F) Mobility diagrams depicting repetitive formation of fluorescent structures near the cell cortex (position of plasma membrane demarcated by black line) and subsequent inward movement in a cell of a confluent monolayer (B) or at free cell edges (D and F). Each diagram was obtained from a line extending from the outermost cell periphery (at right) to the outer KFs in the direction of the cell center (at left). The diagonal stripes show fluorescent structures (inverse presentation) that form in regular intervals at the cell edge and move inward in a continuous motion. Note the reduced frequency in B vs. D and F. Bars, 10 μm in A; 5 μm in B–F.

