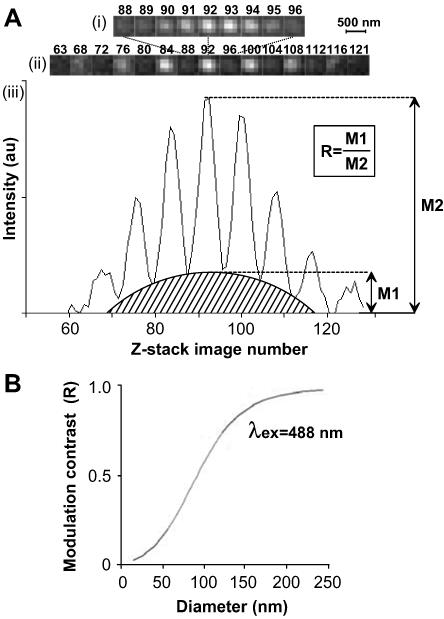
Figure 1.
Measuring the size of fluorescent objects with SMI-microscopy. (A) The SMI-microscope uses two collimated lasers to produce a periodic excitation profile. (A) z-stack images of a 50-nm bead, collected at 20-nm intervals, show variation of emitted light, with the focal plane of the bead corresponding to image 92. i, images 88–96. ii, images corresponding to the brightest peaks and troughs throughout the stack, from image 63 to 121. (Note that the lateral resolution of the SMI-microscope is that of a wide-field microscope.) iii, emission profile representing the intensity values at coordinates located at the center of the bead for each image in the z-stack. The shape of the profile varies with the size of the object and the modulation contrast (R) is proportional to the size of the object in a wavelength-dependent manner. au, arbitrary units. (B) Calibration curve, computer simulated by virtual microscopy, for beads of different sizes, shows the relationship between the modulation contrast (R) and object size for 488-nm excitation wavelength. Experimental values for beads of sizes 40-, 50-, and 100-nm fit this curve. The diameter of structures can be obtained by interpolation of experimental values of R into this calibration curve.

