
Table 2.
Postoperative Results for the Two Groups
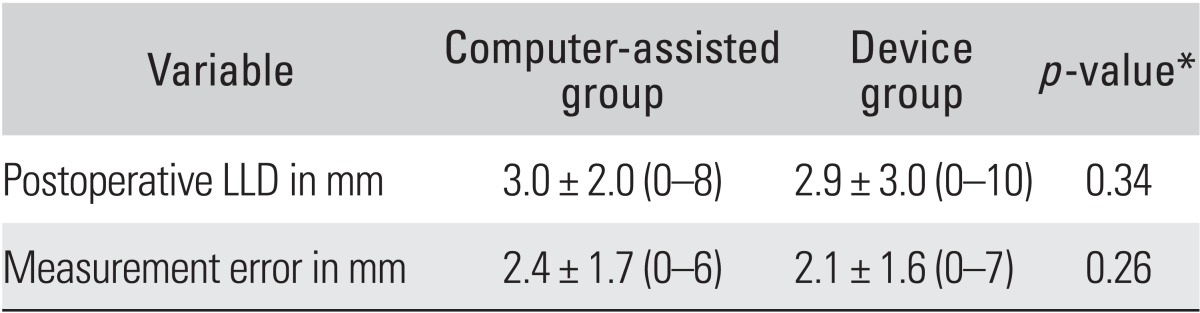
Values are presented as mean ± SD (range).
LLD: leg length discrepancy.
*Mann-Whitney test.
Official websites use .gov
A
.gov website belongs to an official
government organization in the United States.
Secure .gov websites use HTTPS
A lock (
) or https:// means you've safely
connected to the .gov website. Share sensitive
information only on official, secure websites.
Postoperative Results for the Two Groups
Values are presented as mean ± SD (range).
LLD: leg length discrepancy.
*Mann-Whitney test.