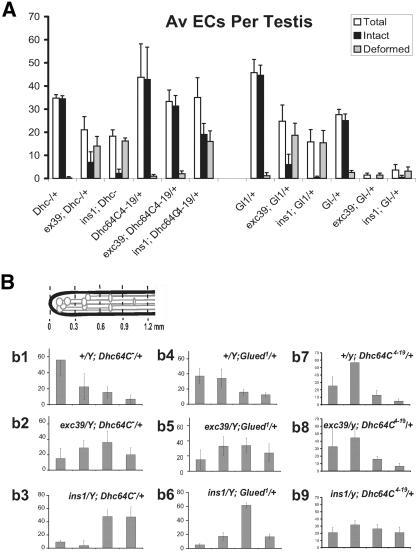
Figure 5.
Additional reduction of DHC and Glued enhanced the EC deformation and spermatid growth defects of ddlc1 alleles. (A) Histogram represents EC morphology parameters counted in different mutant combinations (shown in the x-axis) containing ddlc1 alleles in the background and as described in the previous figure. The error bars indicates ± SD, and N = 4 or more for each data set. (B) EC distribution profile along the length of the testes for different mutant combinations containing ddlc1 alleles in the background and as described in the previous figure. The error bars indicate ± SD, and N = 4 or more for each data set. Df(3L)GN24 is mentioned as DHC– and Df(3L)fzGF3b is mentioned as Gl– in this figure.

