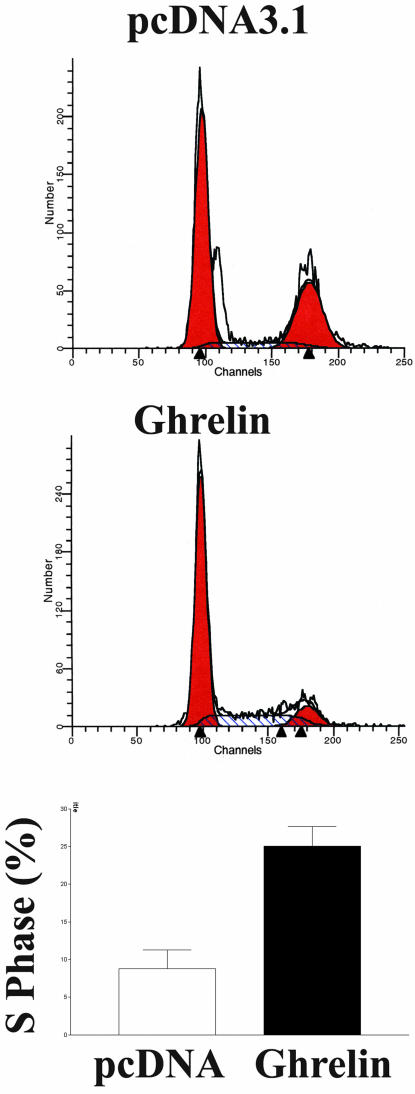
Figure 4.
Analysis of cell cycle by flow cytometry. Cells overexpressing ghrelin or pcDNA3.1 were harvested after culturing for 48 h, stained with propidium iodide in hypotonic lysis buffer, and analyzed by flow cytometry. DNA histogram was deconvoluted, and percentage of cells in each phase of cell cycle was calculated and expressed as mean ± SEM. Results are representative of four separate experiments. *p < 0.05.

