
Table 3.
Sensitivity (Sn), Specificity (Sp), Positive (PPV) and Negative (NPV) Predictive Values Normalized to a 50% Pretest Likelihood of Improvement, and Positive (PLR) and Negative (NLR) Likelihood Ratios for Different Change Thresholds at the Upper Fibers of the Trapezius Muscle (UFT) Site Using the “All 3 Tests” Protocola
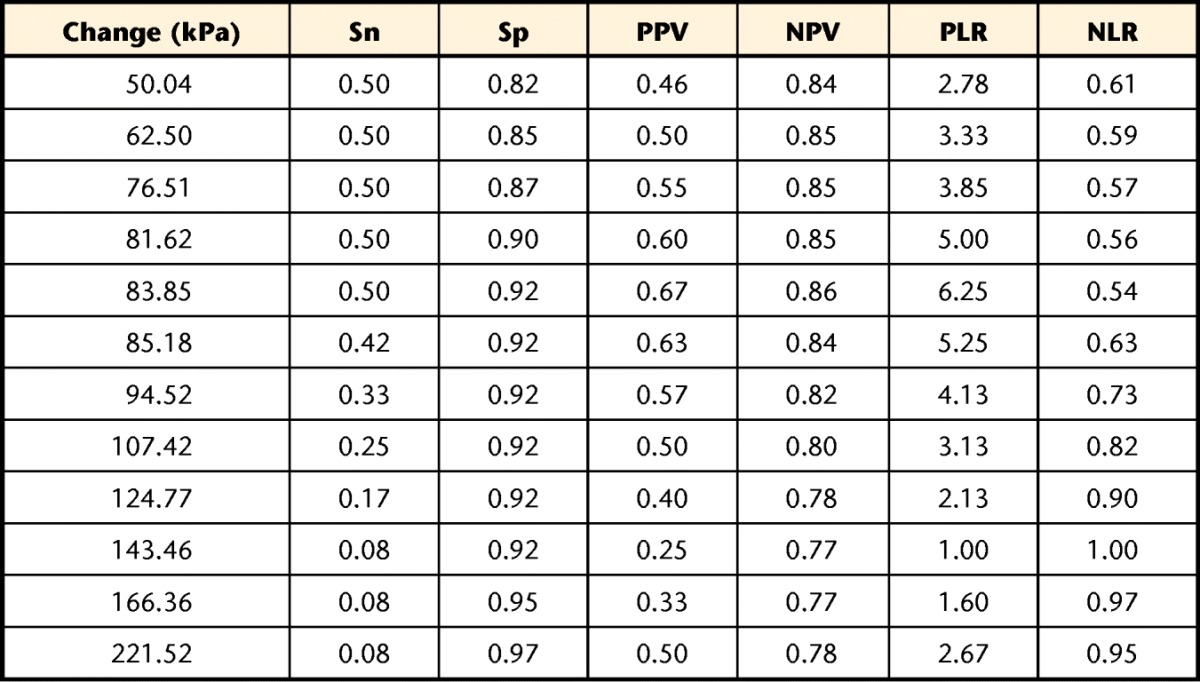
a
The comparator was a Global Perceived Rating of Change change of 3 points (“somewhat better”) or greater.