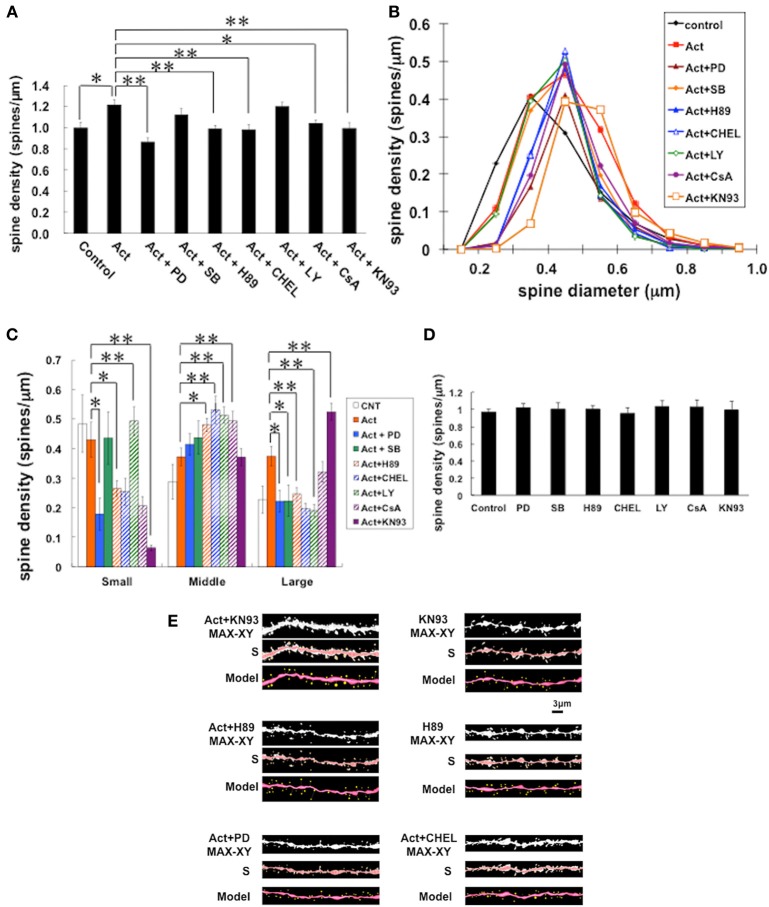
Figure 4.
Effects by inhibition of kinases on changes of the density and morphology of spines in the presence of activin A. Spines were analyzed along the secondary dendrites of CA1 pyramidal neurons. (A) Total spine density. Effect of kinase inhibitors in the presence of activin in CA1 neurons. Vertical axis is the average number of spines per 1 μm. A 2-h treatment in ACSF without drugs (Control), with 10 ng/mL activin (Act), with 10 ng/mL activin and 20 μM PD98059 (Erk MAPK inhibitor) (Act + PD), with 10 ng/mL activin and 10 μM SB203580 (p38 MAPK inhibitor) (Act + SB), with 10 ng/mL activin and 10 μM H-89 (PKA inhibitor) (Act + H89), with 10 ng/mL activin and 10 μM chelerythrine (PKC inhibitor) (Act + CHEL), with 10 ng/mL activin A and 10 μM LY294002 (PI3K inhibitor) (Act + LY), with 10 ng/mL activin and 1 μM cyclosporin A (calcineurin inhibitor) (Act + CsA), and with 10 ng/mL activin and 1 μM KN-93 (CaMKII inhibitor) (Act + KN93). Statistical significance is calculated against activin treated group and indicated by stars. *P < 0.05, **P < 0.01. (B) Histogram of spine head diameters. Abbreviations are the same as in (A). Vertical axis is the number of spines per 1 μm of dendrite. After a 2-h treatment in ACSF without drugs (Control, closed black diamond), Act (closed red square), Act + PD (closed brown triangle), Act + SB (closed orange diamond), with Act + H89 (closed blue triangle), with Act + CHEL (open blue triangle), with Act + LY (open green diamond), and Act + CsA (closed purple circle), and Act + KN93 (open orange square). (C) Density of three subtypes of spines. Abbreviations are the same as in (A). Vertical axis is the average number of spines per 1 μm of dendrite. From left to right, small-head spines (Small), middle-head spines (Middle), and large-head spines (Large). In each group, control (open column), Act (closed orange column), Act + PD (closed blue column), Act + SB (closed green column), Act + H89 (hatched orange column), Act + CHEL (hatched blue column), Act + LY (hatched green column), and Act + CsA (hatched purple column), and Act + KN93 (closed purple column). Statistical significance is calculated against activin treated group in each spine subtypes and comparisons reached significance are indicated by stars. The significance yielded P < 0.05. *P < 0.05, **P < 0.01. (D) No effect of kinase inhibitors alone on the total spine density in CA1 neurons. Abbreviations are same as in (A). (E) Representative spine images of confocal micrographs used for (A–C): activin plus KN-93 treatment (Act+KN93) and only KN-93 treatment (KN93); activin plus H-89 treatment (Act+H89) and only H-89 treatment (H89); activin plus PD98059 treatment (Act+PD); activin plus chelerythrine treatment (Act+CHEL). Maximal intensity projection onto XY plane from z-series (MAX-XY), image analyzed by Spiso-3D (S) and 3 dimensional model (Model) are shown together. Bar, 3 μm. In (A,C,D), results are reported as mean ± s.e.m. For each drug treatment, we investigated 3 rats, 7 slices, 14 neurons, 28 dendrites and 1400–2000 spines. For control, we used 5 rats, 8 slices, 16 neurons, 31 dendrites and approx. 1700 spines.

