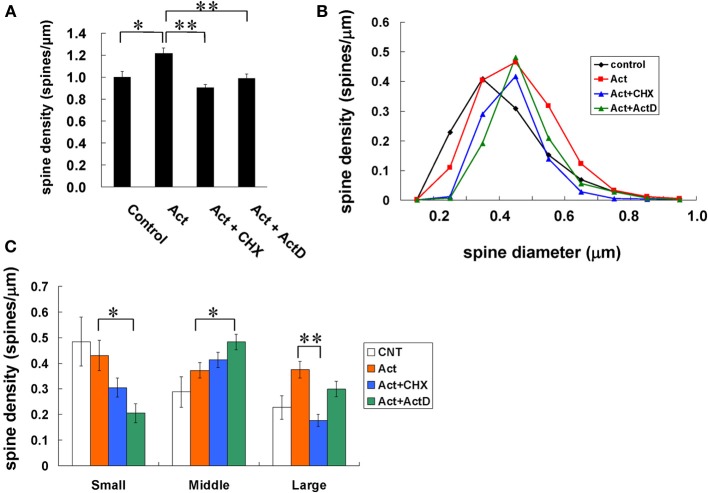
Figure 5.
Effects of protein and mRNA synthesis on changes in the density and morphology of spines by activin. Spines were analyzed along the secondary dendrites of CA1 pyramidal neurons as in Figure 3. (A) Total spine density. Effect of inhibitors for protein or mRNA synthesis in the presence of activin on CA1 neurons. Vertical axis is the average number of spines per 1 μm. A 2-h treatment in ACSF without drugs (Control), with 10 ng/mL activin (Act), with 10 ng/mL activin and 20 μM cycloheximide (Act + CHX), and with 10 ng/mL activin and 4 μM actinomycin D (Act + actD). Statistical significance is calculated against activin treated group. *P < 0.05, **P < 0.01. (B) Histogram of spine head diameters. Abbreviations are same as in (A). Vertical axis is the number of spines per 1 μm of dendrite. After a 2-h treatment in ACSF without drugs (Control, closed black diamond), Act (closed orange square), Act + CHX (closed blue triangle), and Act + ActD (closed green triangle). (C) Density of three subtypes of spines. Abbreviations are same as in (A). Vertical axis is the average number of spines per 1 μm of dendrite. From left to right, small-head spines (Small), middle-head spines (Middle), and large-head spines (Large). ACSF without drugs (open column), Act (orange column), Act + CHX (blue column), Act + actD (green column). Statistical significance is calculated against activin treated group in each spine subtypes and comparisons reached significance are indicated by stars. The significance yielded P < 0.05. *P < 0.05, **P < 0.01. In (A,C) results are reported as mean ± s.e.m. For each drug treatment, we investigated 3 rats, 6 slices, 12 neurons, 24 dendrites and 1100–1800 spines. For control, we used 5 rats, 8 slices, 16 neurons, 31 dendrites and approx. 1700 spines.

