Figure 6.
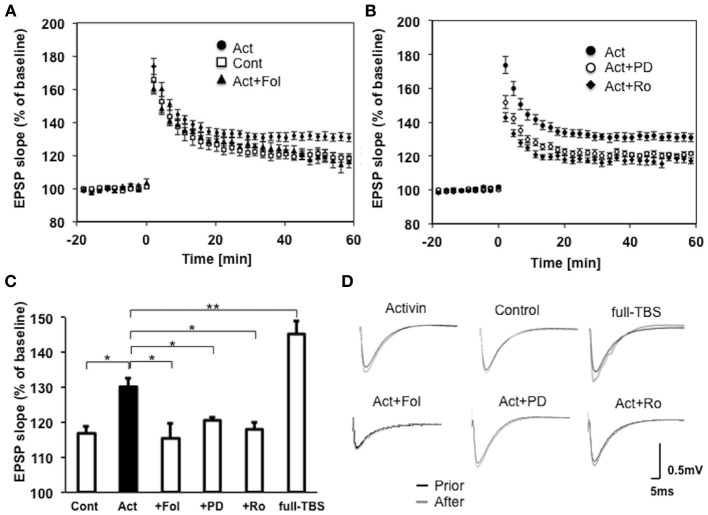
(A) Induction of moderate LTP by weak-TBS stimulation after short incubation (~2 h) with activin in the CA1 of hippocampal slices. Slices with 0 ng/ml activin (control, open square, n = 10 slices, 10 rats), with 10 ng/ml activin (closed circle, n = 10 slices, 10 rats), with 10 ng/ml activin plus 100 ng/ml follistatin (closed triangle, n = 7 slices, 7 rats), with respectively. The number of independent experiments is indicated as n. Vertical axis indicates EPSP slope. Here, 100% refers to the EPSP slope value of the average of t = −10 to −1 min prior to weak-TBS stimulation. LTP was induced at time t = 0. Illustrated data points and error bars represent the mean ± s.e.m. from n of independent slices. (B) Co-incubation of activin with MAPK inhibitor PD98059 (20 μ M) prevented the induction of LTP (open circle, n = 7 slices, 7 rats). Co-incubation of activin with NR2B inhibitor Ro25-6981 (1 μ M) prevented the induction of LTP (open square, n = 7 slices, 7 rats). Activin-treated slices (closed circle, n = 10 slices, 10 rats). Maximal LTP by full-TBS is also shown (closed circle, n = 7, 7 rats). (C) Comparison of modulation effects by activin upon weak-TBS as shown in (A) and (B). From left to right; slices without drugs (Cont), with 10 ng/ml activin (Act), with activin plus follistatin (+Fol), activin plus PD98059 (+PD), activin plus Ro25-6981 (+Ro) and full-TBS (full-TBS). The significance yielded p < 0.05. *P < 0.05, **P < 0.01. (D) Representative raw traces of EPSP, showing sample recordings prior to (black line) or after (gray line) weak-TBS stimulation. Control (0 ng/ml activin), Act (10 ng/ml activin), Act+ PD (activin plus PD98059), Act + Ro (activin plus Ro25-6981). EPSP trace for full-TBS is also shown.

