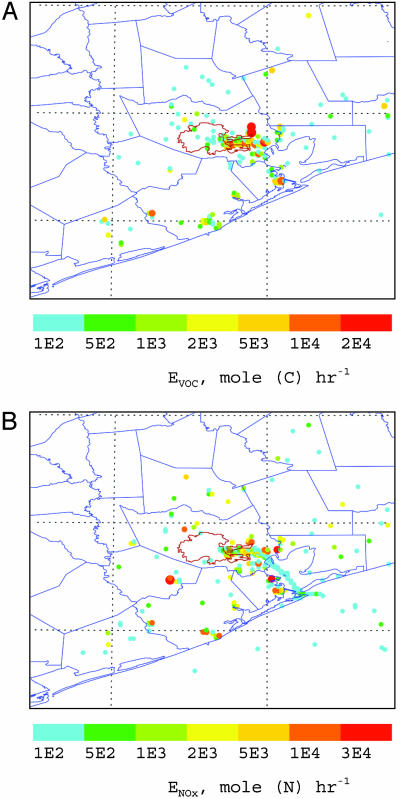
Fig. 1.
Daily averaged industrial point emissions of VOCs (A) and NOx (B) in the Houston metropolitan area during the model simulation period. The thin red lines mark the Houston City limit, and the blue lines label the county limits near Houston. In the NOx panel, the blue dotted line along the Galveston Bay corresponds to ship emissions. The sizes of the symbols correlate to the emission strengths. The high emissions of VOCs and NOx concentrating near the Houston Ship Channel and along the west coastline of the Galveston Bay are from petrochemical plants. Another intensive NOx emission to the southwest of the Houston downtown area is from utility power plants. Diurnal variations of the industrial VOC and NOx emissions are generally within 20%.

