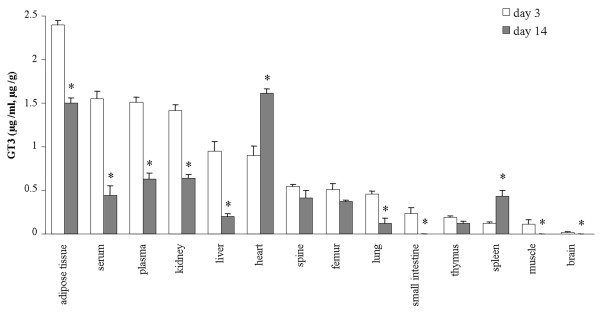
Figure 2.

Histogram of tissue distribution of GT3. Histogram of tissue distribution of GT3 on day 3 and 14 after subcutaneous injection of GT3 with PEG-400 emulsion. The level of control group was used as a baseline value and the concentrations of GT3 were subtracted from baseline value for the experiment groups (day 3 and day 14). *, P < 0.05 by Student’s t test compared with day 3.
